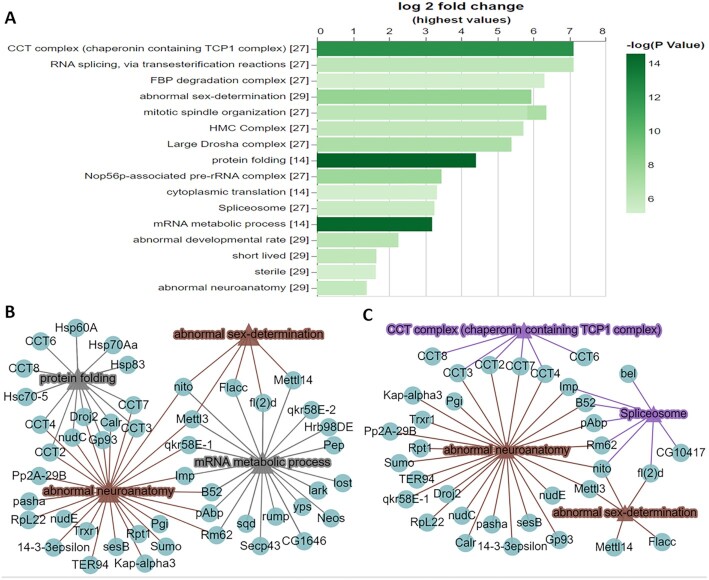
Figure 1.
Example of analysing a single gene list using PANGEA. A proteomic interaction dataset was selected from a study of the m6A methyltransferase complex MTC (30). The 75 high-confidence interactors of the four subunits of the MTC (METTL3, METTL14, Fl(2)d and Nito) identified by affinity-purified mass spectrometry from Drosophila S2R+ cells were submitted via the ‘Search Single’ option at PANGEA and enrichment analysis was performed over phenotype, GO SLIM2 BP and protein complex annotation from COMPLEAT (literature based). The result was filtered using P value 1 × 10⁻⁵ cut-off and was illustrated as (A) a bar graph and (B) a network graph of selected gene sets from phenotype annotation and GO SLIM2 BP. Triangle nodes represent gene sets and circle nodes represent genes while the edges represent gene to gene set associations. (C) A network graph for selected gene sets from phenotype annotation and COMPLEAT protein complex annotation (literature based).

