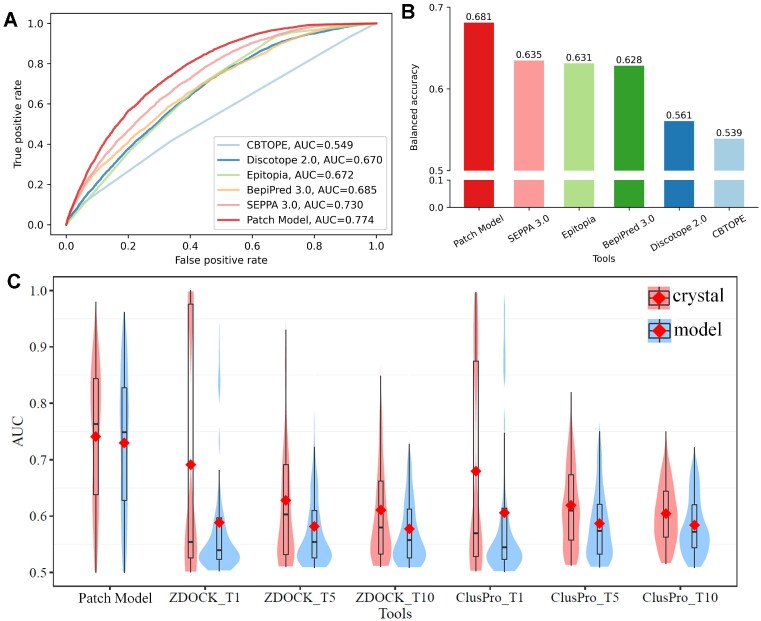
Figure 1.
Performance comparison between patch model and available state-of-the-art methods. (A) ROC curves for traditional epitope prediction methods on independent test dataset containing 193 antigens. (B) Balanced accuracy for epitope prediction methods on independent test dataset containing 193 antigens. (C) AUC distribution in violin plot on test dataset containing 193 antigens for patch model, ZDOCK and ClusPro respectively. The red dot represented the averaged AUC value for different methods. T1, T5 and T10 represent the top 1, top 5 and top 10 output lists from docking approaches respectively over the test dataset containing 193 antigens. The results obtained by experimental structures and modelled structures were colored in red and blue respectively.

