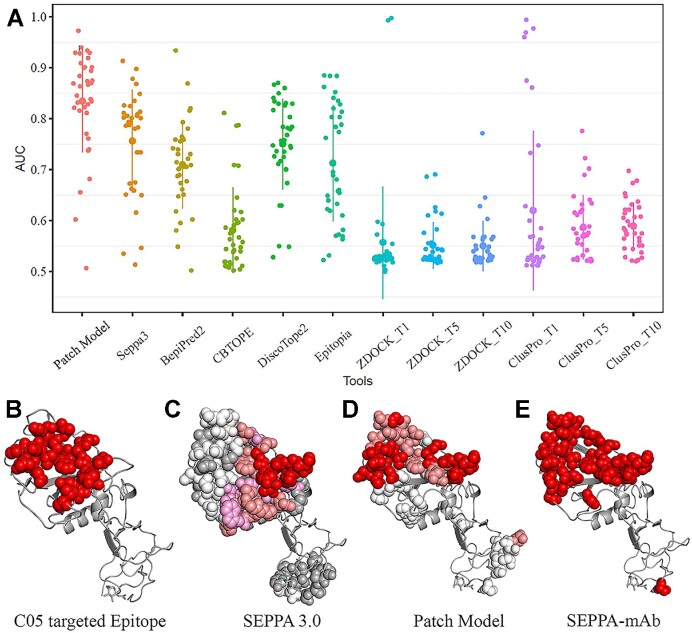
Figure 2.
Performance and case study of SEPPA-mAb. (A) AUC values for patch and current state-of-the-art methods on the independent testing dataset of 36 gp120 antigens. T1, T5, and T10 represent the average AUC value of the top 1, top 5 and top 10 solutions for docking approaches respectively. (B) Reference epitope targeted by antibody C05 (PDB ID: 6D0U, Chain: G). (C) Predicted epitope residues for HA by SEPPA 3.0 with the gradient illustration under default cutoff. Red, salmon, pink, white, and grey color illustrate those candidates from high score to low score. (D) Predicted epitope residues for HA by Patch Model with gradient illustration under default cutoff. Red, salmon and white colors illustrate those candidates from high scores to low scores. (E) Combined epitope residues by incorporating SEPPA 3.0 with Patch Model.

