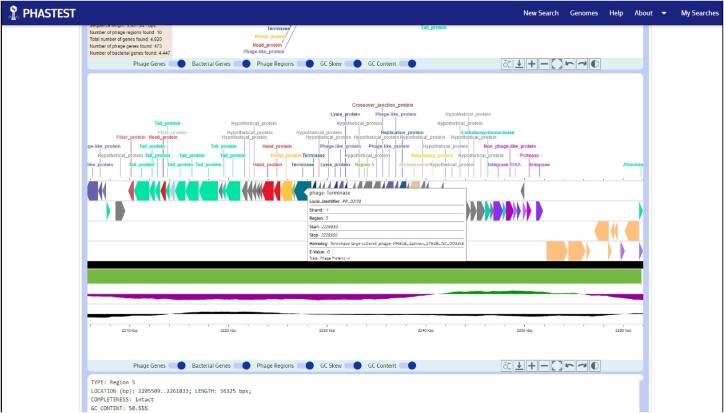
Figure 3.
Popup gene cards generated for specific regions or genes. Hovering their cursor over any predicted region in the circular or linear genome view generates a popup card with the location of the prophage region, its start and stop positions, the completeness level, the GC content and the prophage name. Hovering their cursor over any predicted gene reveals the gene name, local identifier, the strand (+ or –), the region, the start and stop positions, the highest scoring homolog and BLAST E-value.

