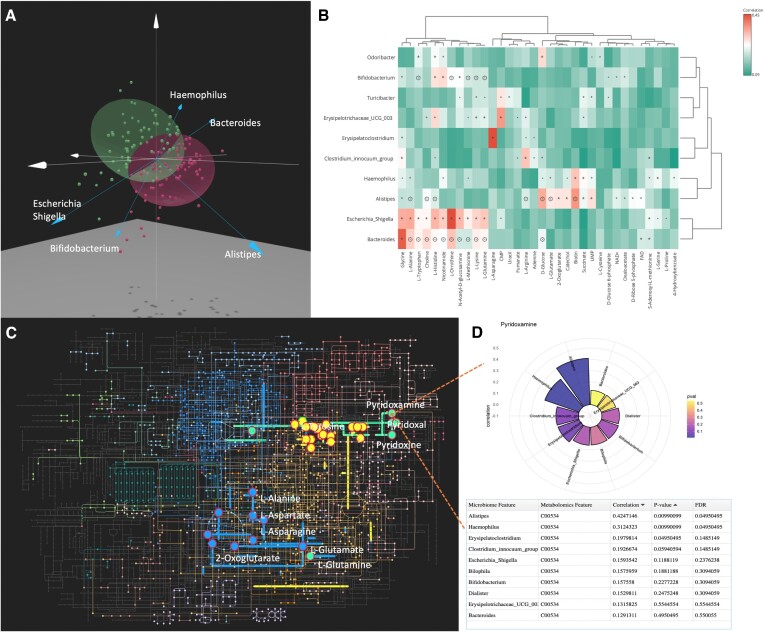
Figure 2.
(A) DIABLO result visualized in 3D scatter plot. (B) Statistical correlation results overlayed with model-based correlation heatmap. Features passed the threshold of adjusted P-value 0.1 were used in this analysis. The color gradients indicate the statistical correlations and asterisks show the statistically significant correlation filtered by raw P-value 0.05. Diamonds indicate the correlations were also predicted by the GEM-based prediction models. (C) Pathway enrichment results based on KOs and metabolites (yellow: tyrosine metabolism; green: vitamin B6 metabolism; blue: alanine, aspartate and glutamate metabolism). (D) Circle plot with a detailed table below showing the most related taxa for the selected metabolite, pyridoxamine. The result was obtained by clicking the corresponding node.

