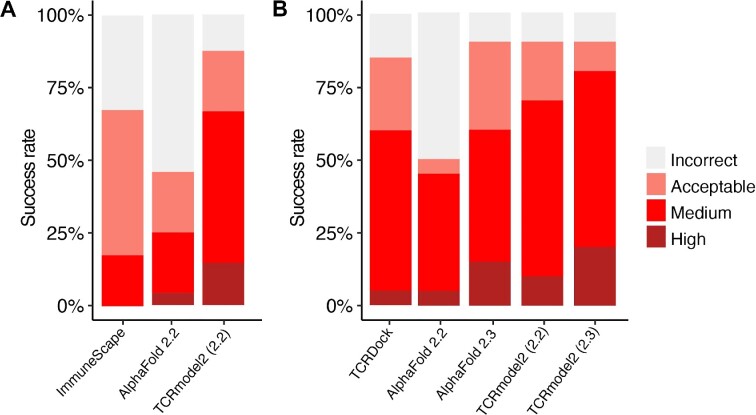
Figure 1.
Success rate of TCRmodel2 and comparison with other modeling algorithms. (A) Modeling success comparison of AlphaFold 2.2, TCRmodel2 with the AlphaFold 2.2 model (2.2) and ImmuneScape on the initial set of 48 TCR–pMHC benchmarking cases. A template date cutoff of 30 April 2018 was applied. Due to technical issues with 8 cases (job failures, template/case overlap, or MHC allele not available), ImmuneScape success rate calculations are for a subset of 40 cases. (B) Modeling success comparison of AlphaFold 2.2, AlphaFold 2.3, TCRmodel2 with the AlphaFold 2.2 model (2.2), TCRmodel2 with the AlphaFold 2.3 model (2.3) and TCRDock on a recently released set of 20 TCR–pMHC structures. Modeling success denotes the success rate of top-ranked prediction if multiple predictions were produced by the modeling algorithm. Three predictions were generated per case by TCRDock, and were ranked by AlphaFold pAE score. For AlphaFold and TCRmodel runs, one prediction per deep learning model was generated, resulting in five predictions per case, ranked by model confidence score. All models were assessed by CAPRI criteria of Incorrect, Acceptable, Medium and High accuracy.

