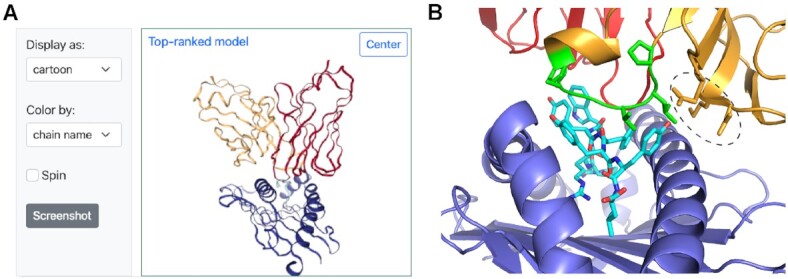
Figure 3.

Example TCR–pMHC modeling output from TCRmodel2. (A) A TCR–pMHC complex with a human TCR, SARS-CoV-2 nucleocapsid epitope and HLA-B*07:02 MHC from a recent study (39) was modeled using TCRmodel2. The visualization of the top-ranked model from the Results page is shown, with TCR α chain red, β chain orange, peptide cyan and MHC blue. (B) The interface between the TCR and pMHC of the top-ranked model is shown, with TCR, peptide and MHC chains colored as in panel (A), and shared CDR3β motif residues (sequence: PLVGAP) colored green and shown as sticks. Peptide residues are shown as sticks, and TCR CDR1β and CDR2β residues interacting with the MHC and/or peptide are shown as sticks and circled. Structure visualized using PyMOL (Schrödinger, Inc.).
