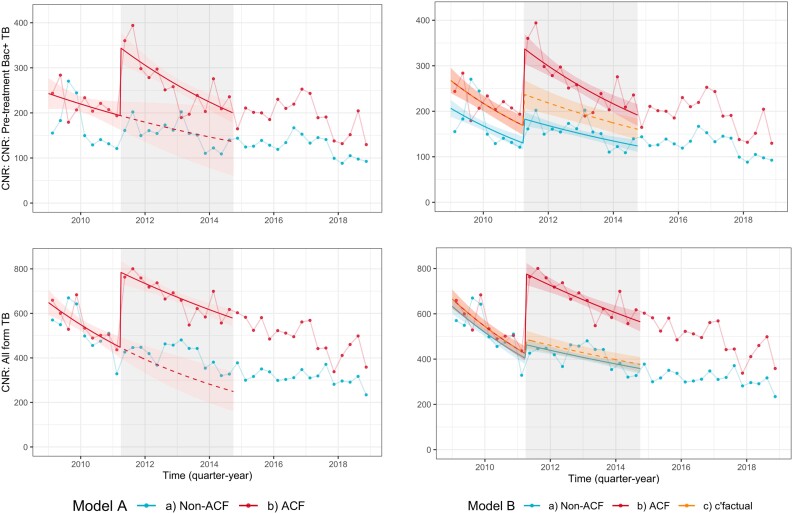
Figure 3.
Trends in tuberculosis case notification rates. Quarterly tuberculosis diagnoses per 100 000 person-years (points), with model-predicted tuberculosis diagnoses (solid lines for observed [ACF] scenarios and dotted lines for counterfactual scenarios). Red is ACF areas, blue is non-ACF areas, orange represents a counterfactual scenario where tuberculosis diagnoses increase in ACF area by the same magnitude as they did in non-ACF areas. Top panel is model A (ACF area only) and bottom panel is model B (compared to non-ACF areas). See methods and appendix for model description. Abbreviation: ACF, active case finding.

