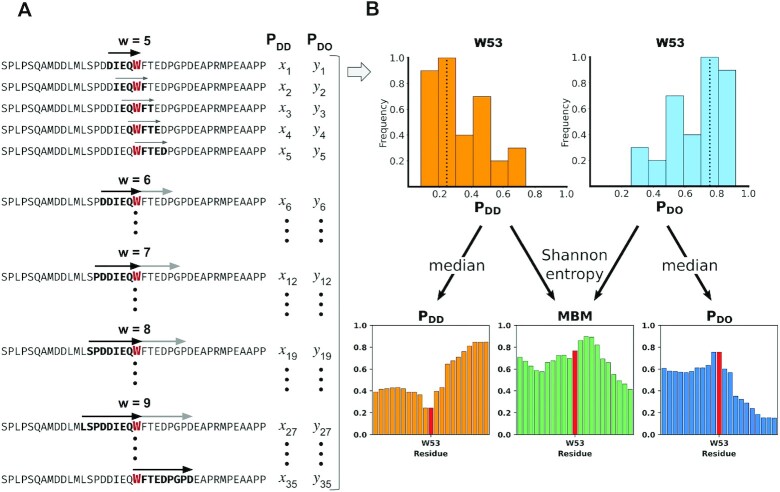
Figure 2.
Schematic representation of the multiplicity of binding modes (MBM) calculation. (A) Representation of the putative binding sites. The p53 (UniProt code: P04637) transactivation (TAD) region can interact through various binding sites, the size and precise location of which are not known a priori. To predict the binding features of residue W53, for example, we consider different possible binding sites with size varying between five and nine residues. The local sequence bias is determined for all possible binding sites (windows), at all possible locations involving W53 (left panel). (B) Binding mode distribution analysis. This procedure generates the distribution of disorder-to-order (blue, right top) and disorder-to-disorder (orange, right top) binding modes as computed from 35 pDO and pDD values. The median of such pDO and pDD distributions provides the most likely pDO and pDD value, based on which the binding mode can be assigned (13). According to these predictions, W53 is likely to undergo disorder-to-order transition upon binding. The information content of the pDO and pDD distributions, which can be computed as a Shannon entropy, informs on the likelihood to change the binding mode with the conditions (18). This is represented by the multiplicity of binding mode (MBM) graph shown on the right bottom, middle panel), where the Shannon entropy is normalised into [0,1] range (14). The MBM graph indicates that W53 likely changes binding modes and can possibly serve as an aggregation hot-spot.

