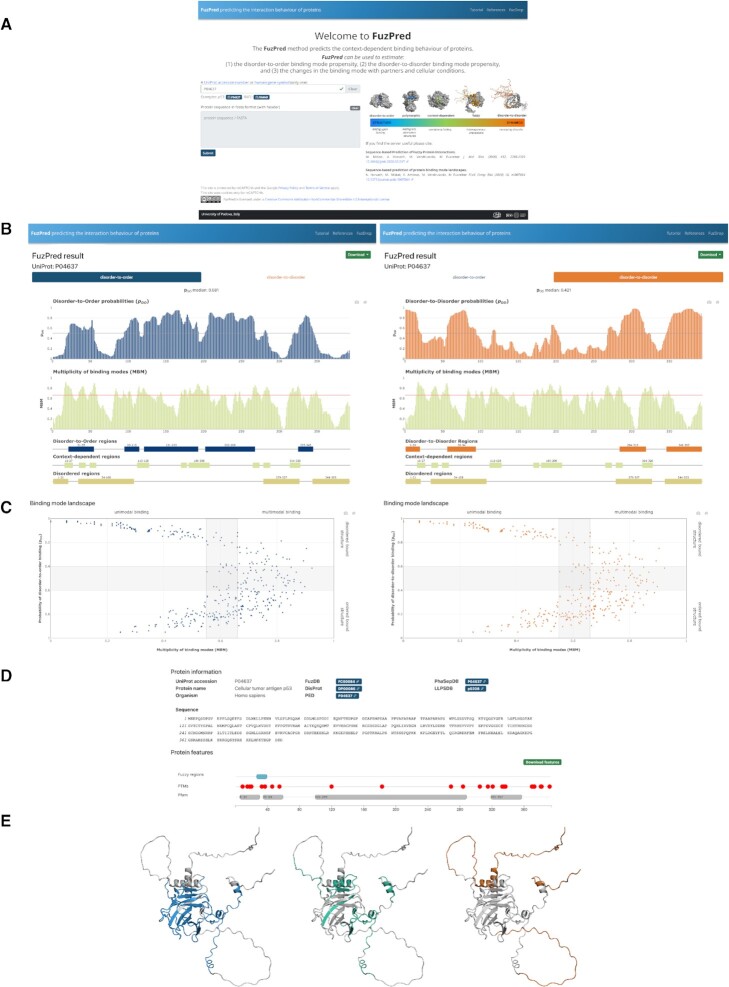
Figure 4.
FuzPred server Input (A) and Result's (B–E) pages. The usage of the FuzPred server is illustrated using the sequence of the p53 tumor suppressor. (A) Input page. The input can be specified by the gene or UniProt identifier (P04637). Alternatively, the sequence can be provided, using only standard amino acids. In case of modified sequence, the cross-links with other databases, such as UniProt, Pfam will not be displayed on the Results page. (B) Prediction of binding mode and multiplicity of binding modes. The user may choose from the upper tabs to display the residue-specific probabilities of disorder-to-order (pDO, left) or disorder-to-disorder (pDD, right) transitions. In both cases, the multiplicity of binding modes (MBM) is displayed below. This graph, reflecting context-dependence of the interactions, does not depend on the binding mode analyzed. Regions undergoing disorder-to-order (left, blue) or disorder-to-disorder transitions (right, orange) are displayed under the MBM graph. In both cases, context-dependent regions (MBM ≥ 0.65, light green) and disordered regions by the Espritz algorithm (light brown) are also shown. (C) Binding mode landscape. The binding mode (y-axis: disorder-to-order, left; disorder-to-disorder, right) is displayed as a function of the likelihood of changing the binding mode (x-axis: multiplicity of binding modes, MBM). The characteristics of the four regions of the landscape are labelled, the grey areas have mixed (intermediate) properties. (D) Protein information. Cross-links to experimental databases of protein disorder and liquid-liquid phase separation, and sites of posttranslational modifications. (E) Visualisation of regions with different interaction characteristics. The disorder-to-order (left, blue), the disorder-to-disorder (orange, right) and the context-dependent (green, middle) are displayed on structured generated by AlphaFold.

