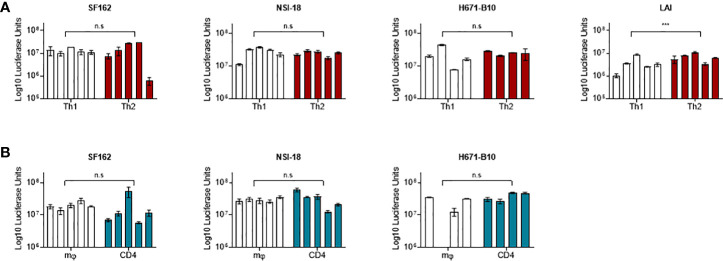
Figure 1.
TZM-bl cell infections. TZM-bl cell infections using 1,000 TCID50 virus clones were measured by luciferase activity, depicted in log scale on the y-axis. (A) Th1-produced (white) and Th2-produced (red) virus (n=5). (B) Macrophage-produced (mφ) (white) and lymphocyte-produced (CD4) (blue) virus (n=5). Virus clones were produced in five replicates for each producing cell type and were used to infect TZM-bl cells in triplicate. For each virus isolate replicate, the median value of a triplicate infection is shown as a single bar on the graph with error bars representing the range. ***, P<0.001; ns, not significant.

