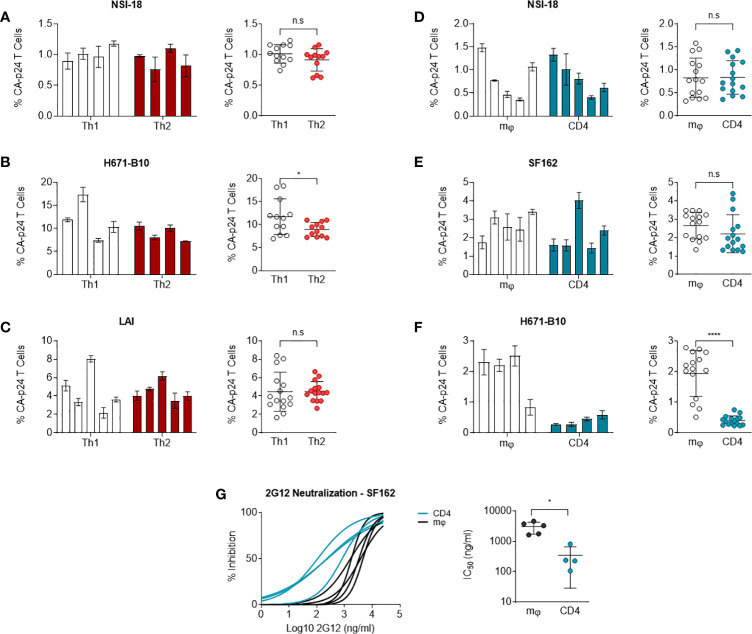
Figure 4.
DC-SIGN-mediated transmission to CD4-enriched lymphocytes. NSI-18, H671-B10 and (A–C) Transmission of Th1- (white) versus Th2-produced (red) NSI-18 (CCR5 using) (n=4), H671-B10 (dual-tropic) (n=4) and LAI (CXCR4 using) (n=5). Three to five clones were produced from each cell type and infection experiments were performed in triplicate. The bars represent median values of HIV-infected lymphocytes for each clone. A separate graph depicts the values of all clones from each cell type and we used the Wilcoxon signed rank test to determine statistical significance on transmission of Th1- and Th2-produced variants. (D–F) Transmission of macrophage (mφ)- (white) versus lymphocyte-derived (blue) NSI-18 (CCR5 using) (n=5), SF162 (CCR5 using) (n=5) and H671-B10 (dual-tropic) (n=4). Transmissions with NSI-18 and H671-B10 were repeated once. The bars represent median values of HIV-infected lymphocytes for each clone. A separate graph depicts the values of all clones from each cell type and we used the Wilcoxon signed rank test to determine statistical significance on transmission of mφ - and lymphocyte-produced variants. (G) Sensitivity of macrophage (mφ)- (white) and lymphocyte-derived (blue) SF162 HIV-1 to the carbohydrate dependent 2G12 antibody neutralisation was determined by infecting CD4-enriched lymphocytes with virus, which was neutralized with 3-fold increasing concentrations of antibody. Inhibition curves were constructed based on CA-p24 values from the peak of viral replication. The experiment was conducted twice with one representative profile shown. *, P<0.05; ****, P<0.0001; ns, not significant.

