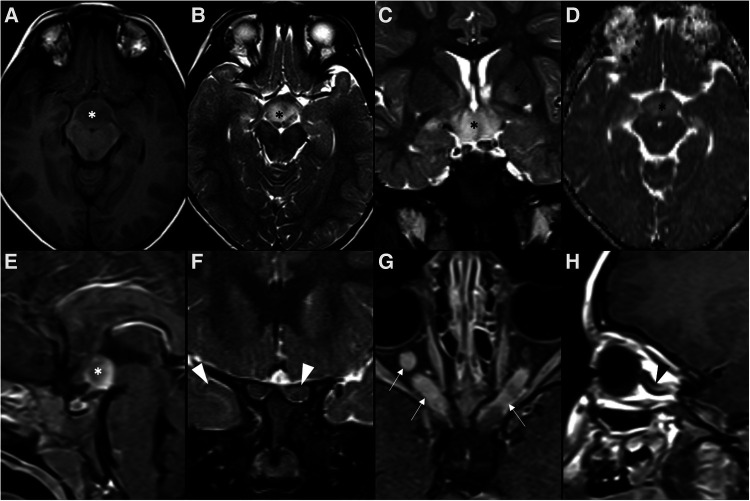
Figure 10.
Neurofibromatosis type 1-related hypothalamic and optic pathway astrocytoma in a 3-year-old boy. Brain MRI axial T1WI (A), and axial (B) and coronal (C) T2WI show a T1 hypointense and T2 hyperintense suprasellar infiltrative neoplasm (asterisks), with facilitated diffusion on ADC map (D) and solid enhancement on sagittal T1WI after paramagnetic contrast media injection (E). Coronal T2W images with fat suppression (E) depict anterior extension to both optic nerves, with T2 signal change and increased thickness (white arrowheads). Enhancement (white arrows) and downward kinking (black arrowhead) of the orbital segment of the optic nerves can be seen on axial (G) and left paramedian sagittal (H) T1WI, respectively. Several focal areas of signal intensity (FASI), including on the left globus pallidus (black arrow on C), were detected.

