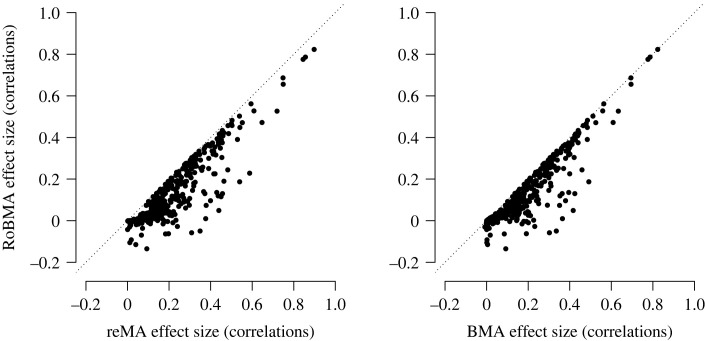
Figure 2.
Effect size estimates from the publication bias adjusted versus unadjusted models. Model-averaged posterior mean effect size estimates based on RoBMA (y-axis) versus mean effect size estimates based on random-effects meta-analysis (reMA, x-axis, left panel) and model-averaged posterior mean effect size estimates based on BMA (x-axis, right panel). Adjustment for publication bias reduces effect size estimates in the majority of meta-analyses (points below the diagonal). One outlier adjusted to −0.46 (from 0.15 with BMA and 0.16 with reMA) is omitted from the display.

