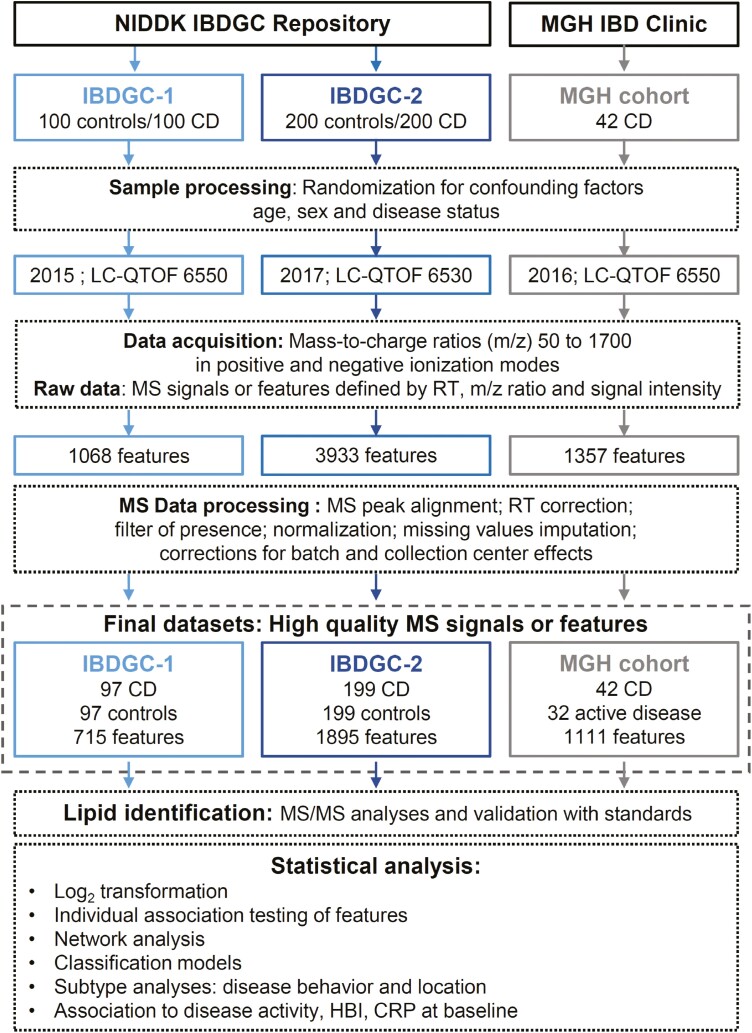
Figure 1.
Flow diagram of the study. The diagram depicts the analytical aspects of the study, in which the study design and the untargeted lipidomic screen are illustrated. First, lipid features were retrospectively measured in serum samples from 300 Crohn’s disease (CD) patients and 300 control subjects, on different liquid chromatography–quadrupole time-of-flight (LC-QTOF) instruments (6550 and 6530; Agilent Technologies Inc), in a 1.5-year interval (from October 7 to November 11, 2015, and from April 2 to May 31, 2017), as 2 independent phases referred as IBDGC-1 and -2. Mass spectrometry (MS) raw data were processed for peak picking and an in-house bioinformatic script encoded in both Perl and R languages for MS peak alignment, retention time (RT) correction, filter of presence, normalization of signal intensities using cyclic loess algorithm, imputation of missing values using k-nearest neighbors (setting k = 5) on scaled data and batch and collection center effect correction using Combat algorithm. The final National Institute of Diabetes and Digestive and Kidney Diseases IBD Genetics Consortium (IBDGC) datasets were analyzed using 3 approaches (individual testing, network analysis, and classification models), and MS/MS was performed on features associated with stricturing or penetrating CD patients vs control subjects with P < .05. Second, lipid features were measured in the serum of 42 CD subjects from July 19 to August 20, 2016, using the LC-QTOF 6550. Following processing of MS raw data, the MGH cohort final dataset was analyzed using individual testing. CRP, C-reactive protein; HBI, Harvey-Bradshaw Index; m/z, mass to charge.

