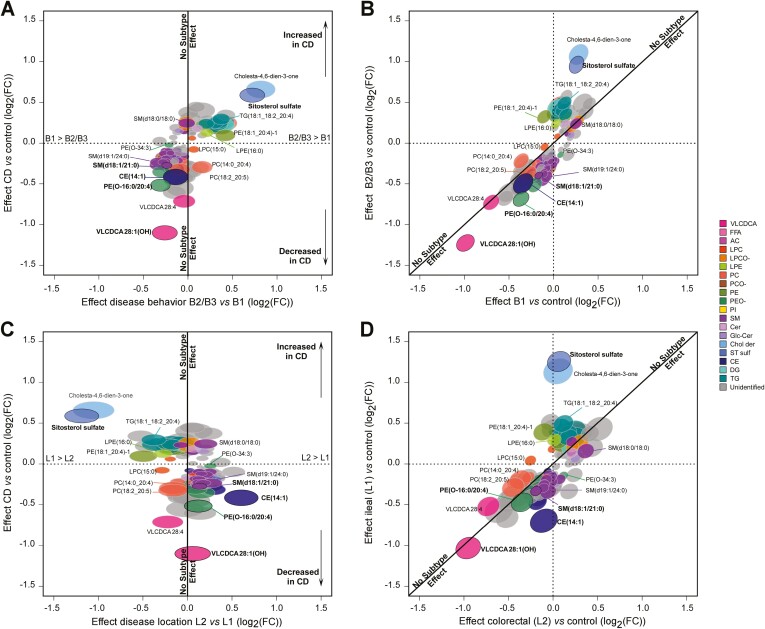
Figure 4.
Comparative effect size of changes in circulating lipid features between Crohn’s disease (CD) subtypes: disease behaviors and locations. The panels show the 182 features associated with P < 1 × 10⁻⁴ for at least 1 CD subtype in IBDGC-2. Fold change (FC) (log2) in mass spectrometry signal intensity values for each feature with respect to disease subtypes is shown on separate axes. Disease behavior is illustrated in panels A and B, while disease location is illustrated in panels C and D. A subtype-dependent effect would fall outside the first diagonal in panels B and D or far from the vertical x = 0 axis in panels A and C. Ellipses correspond to 95% confidence intervals. Lipids with bold ID are components of the classification model (see Figure 5). For expansions of the lipid subclasses, see Figure 2.

