Figure 5.
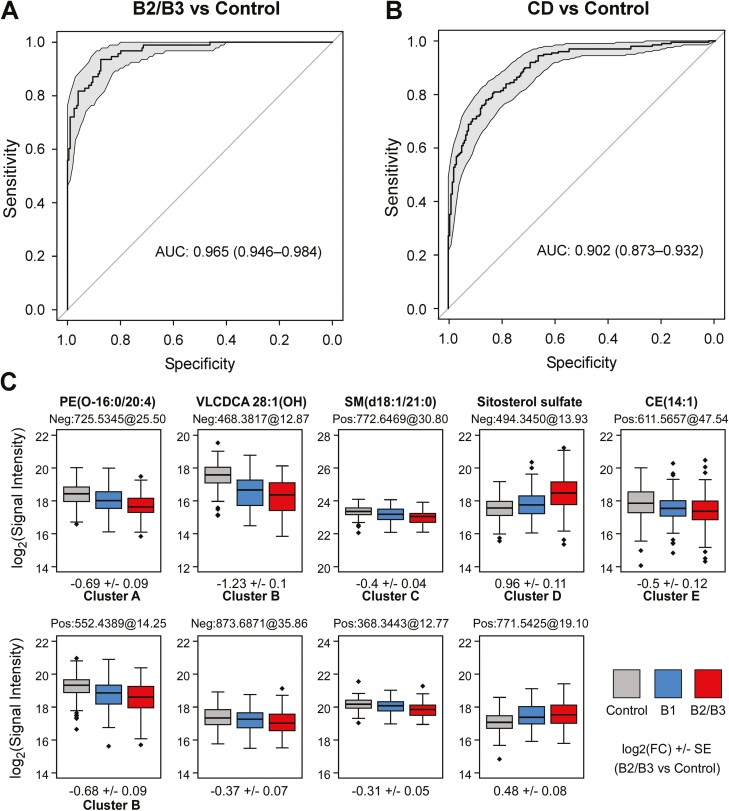
Crohn’s disease (CD) classification model based on serum lipid features. A and B, The receiver-operating characteristic curve shows the performance of the classification model to discriminate case vs control phenotypes. Performance was tested (A) in the IBDGC-2 dataset consisting of all B2/B3 and control samples or (B) in the entire IBDGC-2 dataset (including all CD patients) The 95% confidence interval is shown in grandy and performances are expressed as the area under the curve (AUC). Estimations of out-of-sample performance are reported in Supplementary Figures 4 and 5. C, The boxplots represent the mass spectrometry signal intensity values (log2) with quartiles for the 9 classifiers, within control subjects (gray), B1 patients (blue), and B2/B3 patients (red) in IBDGC-2. For expansions of the lipid subclasses, see Figure 2. FC, fold change.

