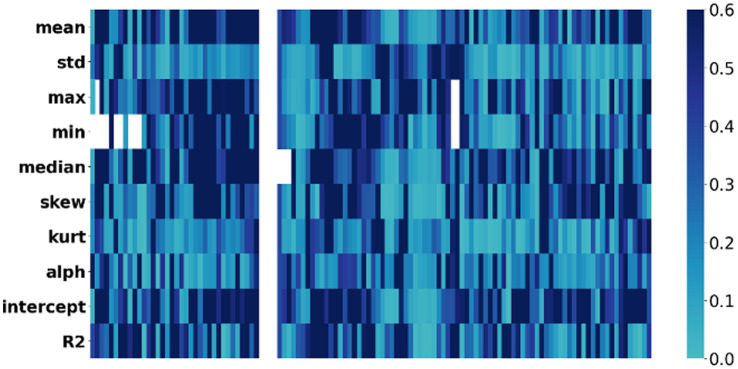
Figure 2.
Correlation heatmap: voice acoustic features associated with severity of depressive symptoms. The x-axis represents the severity of symptoms, while the y-axis represents the voice acoustic features. The colors on the heatmap correspond to the correlation coefficient between symptom and acoustic feature, with blue indicating a lower correlation and black indicating a higher correlation.

