Figure 2.
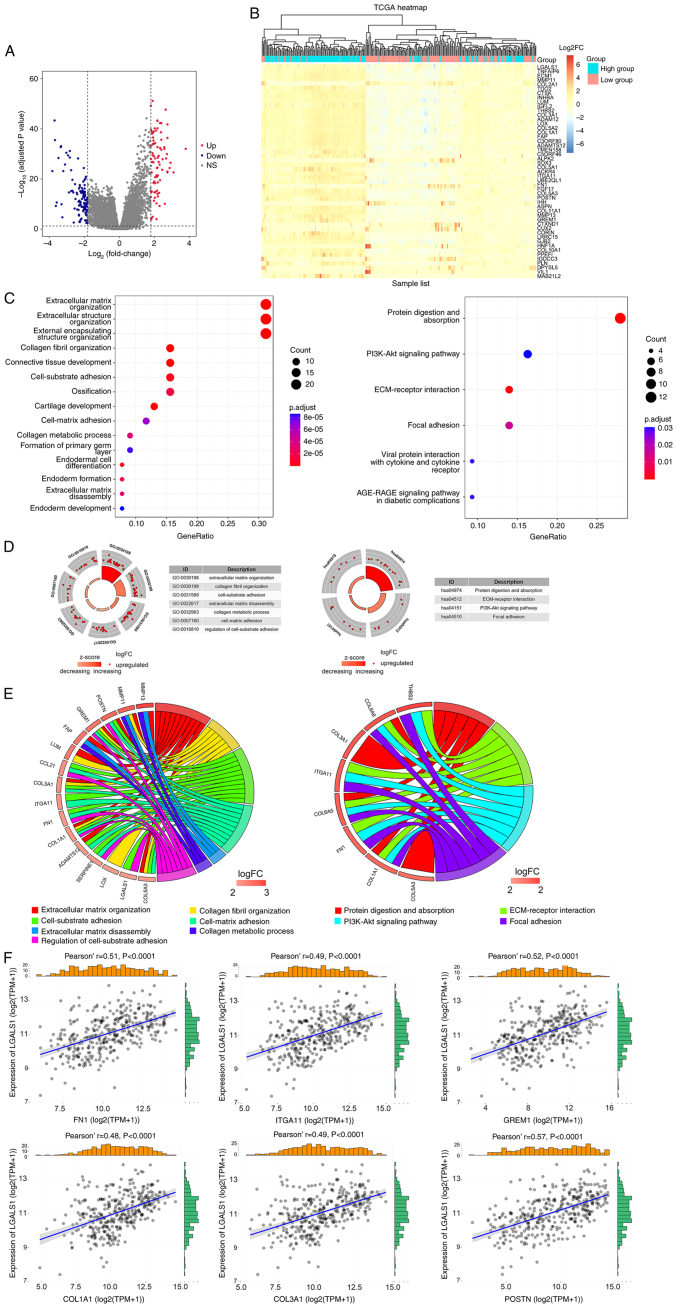
Identification and function annotation of DEGs. (A) Volcano map of DEGs between high and low LGALS1 groups, using abslog2(FC)>1.8 and FDR <0.05/adjusted P-value <0.05 as the threshold. Red dots represent upregulated genes, blue dots represent downregulated genes and gray dots represent genes that were not significantly differentially expressed. (B) Hierarchical clustering of DEGs in high and low LGALS1 groups. Each column represents a sample and each row represents a gene. The expression of each sample is represented as a log2FC value (scale of −6 to 6). The color gradient from blue to red represents downregulation to upregulation of gene expression. The top 50 DEGs are displayed ordered according to the adjusted P-value (smallest to largest). (C) Top 15 representative GO biological processes of DEGs, and the six representative KEGG pathways of DEGs. (D) Enrichment results. The outer circle is the term, the middle circle is the difference and the inner circle is the z-score (indicating whether the term is upregulated or suppressed). The term name corresponds to the GO ID. (E) Distribution of DEGs for biological processes is shown as a chord map. The DEGs are depicted on the left side of the map, and the FC values are represented by the color scale. Colored lines show the connection between genes and biological functions. (F) Correlation between LGALS1 and CAM genes in OC examined using TCGA. CAM, cell adhesion molecule; DEGs, differentially expressed genes; ECM, extracellular matrix; abs, absolute value FC, fold change; FDR, false discovery rate; GO, Gene Ontology; KEGG, Kyoto Encyclopaedia of Genes and Genomes; LGALS1, galectin-1; OC, ovarian cancer; TCGA, The Cancer Genome Atlas; FN1, fibronectin 1; ITGA11, integrin α 11; GREM1, gremlin 1; COL1A1, collagen type I α 1; COL3A1, collagen type III α 1; POSTN, periostin; NS, not significant; TPM, transcripts per million.

