. 2023 May 31;11(7):946–961. doi: 10.1158/2326-6066.CIR-22-0910

Figure 1.

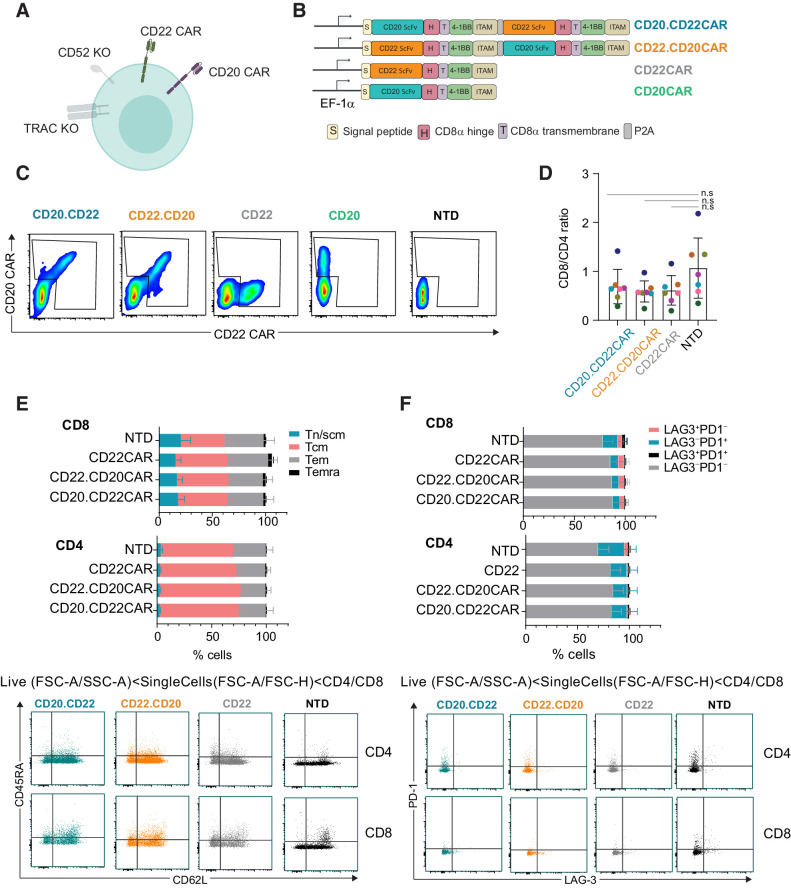
Figure 1. CD20xCD22 CAR T cells can be efficiently generated. A, Diagram showing CD20xCD22 CAR T cells including all attributes. B, Dual and single CAR T-cell constructs used in this study. C, Flow cytometry data showing CAR expression for dual and single CAR T cells (representative diagram of n = 6–15 from four independent experiments). D, Ratio of CD8/CD4 cells in the productions indicated. Mean ± SD is shown. E, Flow cytometry data showing differentiation status of CAR T cells expressing the indicated CAR constructs. Tn/scm: naïve T cells (CD45RA+CD62L+); Tcm: central memory T cells (CD45RA−CD62L+); Tem: effector memory T cells (CD45RA−CD62L−); Temra: effector memory T cells RA (CD45RA+CD62L−). Representative dot plots are shown below. F, Expression of exhaustion markers PD-1 and LAG-3 in CD8+ and CD4+ cells from CD20xCD22 CAR at the end of production. Representative dot plots are shown below. N = 7 from three independent experiments for both E and F. Mean ± SEM is represented. One-way ANOVA was performed with Tukey correction for multiple comparisons was perfomed and no significant differences were identified.

CD20xCD22 CAR T cells can be efficiently generated. A, Diagram showing CD20xCD22 CAR T cells including all attributes. B, Dual and single CAR T-cell constructs used in this study. C, Flow cytometry data showing CAR expression for dual and single CAR T cells (representative diagram of n = 6–15 from four independent experiments). D, Ratio of CD8/CD4 cells in the productions indicated. Mean ± SD is shown. E, Flow cytometry data showing differentiation status of CAR T cells expressing the indicated CAR constructs. Tn/scm: naïve T cells (CD45RA+CD62L+); Tcm: central memory T cells (CD45RACD62L+); Tem: effector memory T cells (CD45RACD62L); Temra: effector memory T cells RA (CD45RA+CD62L). Representative dot plots are shown below. F, Expression of exhaustion markers PD-1 and LAG-3 in CD8+ and CD4+ cells from CD20xCD22 CAR at the end of production. Representative dot plots are shown below. N = 7 from three independent experiments for both E and F. Mean ± SEM is represented. One-way ANOVA was performed with Tukey correction for multiple comparisons was perfomed and no significant differences were identified.