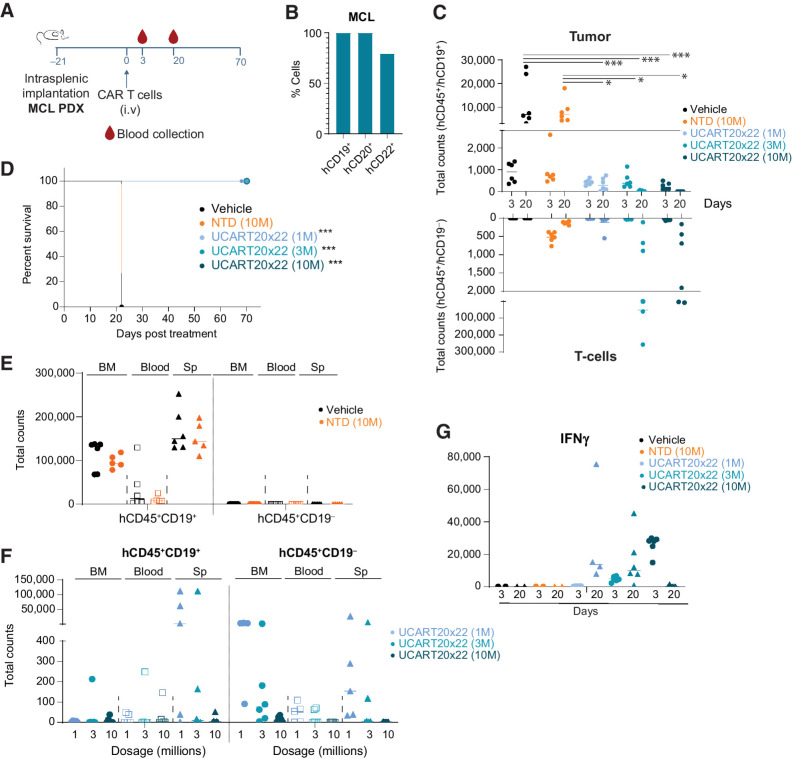
Figure 6.
Patient-derived lymphoma models show improved overall survival upon CD20xCD22 CAR T-cell treatment. A, Schematic showing tumor model experimental design with NSG mice injected intrasplenically with primary MCL samples. n = 6 per condition. B, Levels of CD19, CD20, and CD22 in primary MCL sample. C, Graph showing tumor cells and T cells in peripheral blood collected at different timepoints. One-way ANOVA was calculated and significant events are indicated. D, Kaplan–Meier curves after intravenous administration of different amounts of CAR T cells in the PDX model. E and F, Evaluation of tumor cells (CD45+CD19+ cells) and CAR T cells in the BM, spleen (Sp), and peripheral blood of treated animals at day 22 for vehicle and NTD and day 70 for experimental CAR T-cell treatments. Each dot represents a mouse. G, Graph showing IFNγ levels in the plasma of the indicated mice at different days. One-way ANOVA was calculated for experimental samples and no significant events were identified. Log-rank Mantel–Cox test was calculated for survival curves. Significant values are indicated. P-value definition: *<0.05, **<0.01, ***<0.001, ****<0.0001.

