. 2023 Apr 17;4(4):318–335. doi: 10.1158/2643-3230.BCD-22-0167

Figure 2.

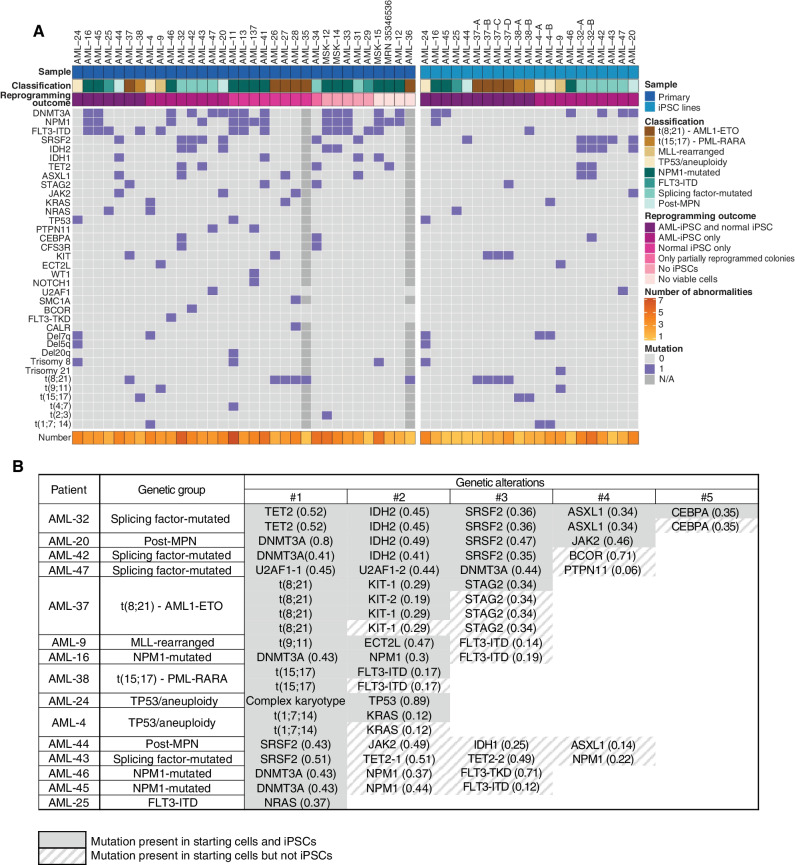
Figure 2. AML-iPSCs capture both late and preleukemic clones arising during the clonal evolution of AML. A, Oncoplots showing all genetic lesions present in the AML patient samples (left) or the AML-iPSC lines generated (right). Letters (A, B, C, D) correspond to iPSC lines derived from different AML clones of the same patient. Classification refers to the genetic group classification of the patient AML. (Note that whereas AML-25 was classified as “FLT3-ITD,” all AML-iPSC lines obtained harbored NRAS and not FLT3 mutations. See also Supplementary Table S2.) B, Table showing the mutations captured in iPSCs from each of the 15 patients with respect to all mutations present in each starting patient sample. Numbers in parentheses show VAFs. The numbers on top represent the order by which mutations were acquired in each patient, inferred from VAF values and reprogramming outcomes (see also Fig. 3; Supplementary Fig. S2). U2AF1-1 and U2AF1-2 denote two different U2AF1 mutations—S34F and Q157R, respectively—present in patient AML-47 and in the derived iPSCs. TET2-1 and TET2-2 denote two different TET2 mutations—4044+1G>C and G1913D, respectively—present in patient AML-43. (See also Supplementary Table S2 for details.) KIT-1 and KIT-2 denote two different KIT mutations—N822K and D816V, respectively—present in patient AML-37 and in the derived iPSCs.

AML-iPSCs capture both late and preleukemic clones arising during the clonal evolution of AML. A, Oncoplots showing all genetic lesions present in the AML patient samples (left) or the AML-iPSC lines generated (right). Letters (A, B, C, D) correspond to iPSC lines derived from different AML clones of the same patient. Classification refers to the genetic group classification of the patient AML. (Note that whereas AML-25 was classified as “FLT3-ITD,” all AML-iPSC lines obtained harbored NRAS and not FLT3 mutations. See also Supplementary Table S2.) B, Table showing the mutations captured in iPSCs from each of the 15 patients with respect to all mutations present in each starting patient sample. Numbers in parentheses show VAFs. The numbers on top represent the order by which mutations were acquired in each patient, inferred from VAF values and reprogramming outcomes (see also Fig. 3; Supplementary Fig. S2). U2AF1-1 and U2AF1-2 denote two different U2AF1 mutations—S34F and Q157R, respectively—present in patient AML-47 and in the derived iPSCs. TET2-1 and TET2-2 denote two different TET2 mutations—4044+1G>C and G1913D, respectively—present in patient AML-43. (See also Supplementary Table S2 for details.) KIT-1 and KIT-2 denote two different KIT mutations—N822K and D816V, respectively—present in patient AML-37 and in the derived iPSCs.