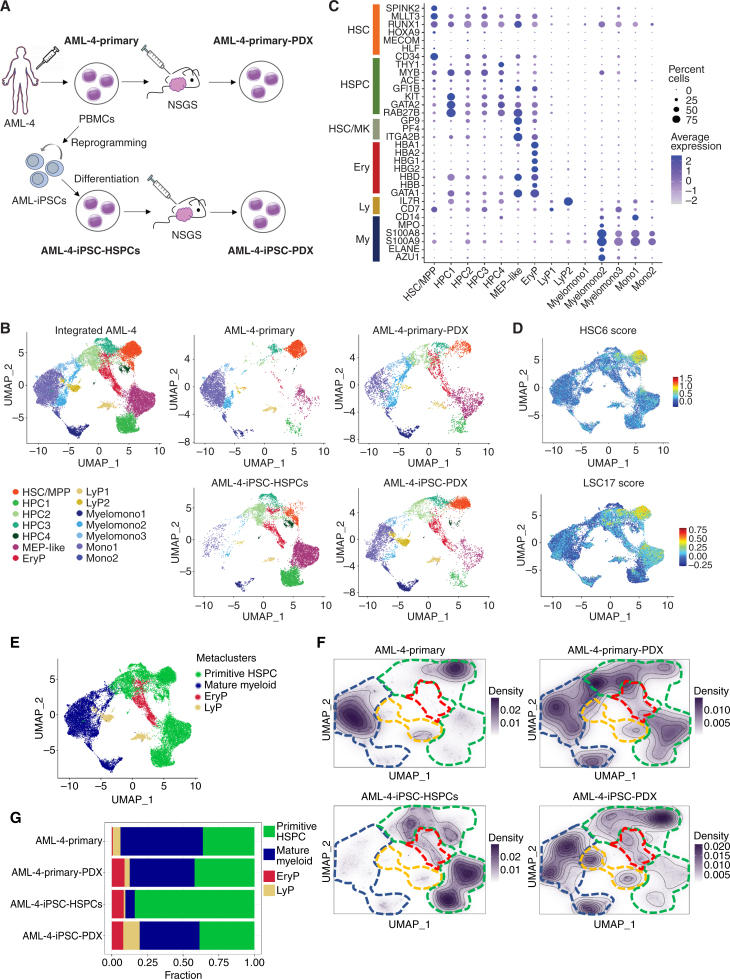
Figure 6.
Single-cell RNA sequencing analyses of matched primary and iPSC-derived leukemia cells from patient AML-4 in vitro/ex vivo and after transplantation. A, Schematic representation of the experimental design. The samples analyzed by single-cell RNA sequencing are: (1) AML-4-Primary: peripheral blood mononuclear cells (PBMC) from AML patient AML-4; (2) AML-4-Primary-PDX: cells (sorted hCD45+) from a mouse xenograft of the AML-4-Primary cells; (3) AML-4-iPSC-HSPCs: cells obtained following in vitro differentiation of the iPSC line AML-4.10, which was derived from the AML-4-Primary cells; (4) AML-4-iPSC-PDX: cells (sorted hCD45+) from a mouse xenograft of the AML-4-iPSC-HSPCs. B, UMAP representation of single-cell transcriptome data colored by cluster. Left: Integrated analysis of all AML-4 subsets. Right: Individual samples, as indicated. Clusters were annotated using known lineage and stem cell marker genes found amongst the most differentially expressed genes in each cluster. HSC/MPP: hematopoietic stem cell/multipotent progenitor; HPC: hematopoietic progenitor cell; MEP: megakaryocyte/erythroid progenitor; EryP: erythroid progenitor; LyP: lymphoid progenitor; Myelomono: mature cells of myelomonocytic lineage; Mono: mature monocytic lineage cells. C, Dot plot showing the expression level of selected marker genes in each cluster. Dot size represents the percentage of cells expressing the marker gene, while dot color represents the scaled average expression of the gene across the various clusters (a negative value corresponds to expression level below the mean). D, HSC6 score based on the expression of the 6 genes RUNX1, HOXA9, MLLT3, MECOM, HLF, and SPINK2 (top) and LSC17 score (bottom), projected onto the integrated analysis UMAP from B. E, UMAP plot from B colored by metacluster. F, Cell density across the UMAP coordinates of each sample displayed as contours filled by a dark violet color gradient. The 4 metaclusters from E are indicated by dashed lines (green line: primitive HSPC; blue line: mature myeloid; red line: EryP; yellow line: LyP). G, Bar plots showing the proportion of cells in each metacluster for each sample.

