. 2023 Apr 18;4(4):294–317. doi: 10.1158/2643-3230.BCD-22-0162

Figure 1.

Figure 1. Activation of the polyamine–hypusine circuit is a hallmark of MYC-driven cancers. A, Schematic of the polyamine–hypusine pathway. AMD1, adenosylmethionine decarboxylase-1; dcSAM, decarboxy SAM; DHPS, deoxyhypusine hydroxylase; DOHH, deoxyhypusine hydroxylase; DFMO, difluoromethylornithine; eIF5A, eukaryotic translation initiation factor 5A; GC7, N1-guanyl-1, 7-diamine-heptane; Hyp, hypusine; ODC, ornithine decarboxylase; SAM, S-adenosylmethionine; SMS, spermine synthase; SRM, spermidine synthase. B, Copy-number alterations (CNA) of EIF5A across different cancer types. The abbreviations for the tumor types are provided in Supplementary Fig. S1A. C, EIF5A and EIF5A2 levels in RNA sequencing datasets in 17 cancer types derived from TCGA PanCanAtlas. D, EIF5A transcript levels relative to normal tissue, classified based on EIF5A copy number (TCGA data sets). E, Representative hematoxylin and eosin (H&E) staining and IHC of MYC, eIF5A, and hypusinated eIF5A (eIF5AHyp) proteins in patients with either BL (n = 7) or DHL (n = 18), or reactive lymph node samples (n = 13; Moffitt Cancer Center; scale bar, 50 μm). F, Box plots showing IHC staining (%) of the indicated proteins for each patient (open circle). G, Expression of genes in the polyamine–hypusine circuit following induction of MYC in p493-6 human B-lymphoma cells, as analyzed by qRT-PCR (n = 3, fold change to expression at time 0). H, Immunoblot analyses of MYC, DHPS, DOHH, eIF5A, and eIF5AHyp levels in p493-6 human B-lymphoma cells following MYC induction. I and J, Gene-expression profiling of arrays showing the polyamine-hypusine genes in mouse splenic B220+ B cells from premalignant Eμ-Myc (n = 5) and wild-type (WT; n = 4) mice and Eμ-Myc lymphomas (n = 13) from GSE32239 (I), and bone marrow (BM) of premalignant Eμ-Myc (n = 2) and WT (n = 2) littermate mice from GSE33474 (J). Rows represent different probe sets. K, Representative immunoblots of eIF5A and eIF5AHyp in mouse B220+ B cells isolated from BM of 6-week-old WT mice (n = 5) and premalignant Eμ-Myc mice (n = 4), and in lymphomas isolated from Eμ-Myc mice (n = 5). Levels of significance determined by Mann–Whitney test (B), Dunnett multiple comparison (F) or unpaired t tests (J) are indicated as follows: *, P < 0.05; **, P < 0.01; ***, P < 0.001; ****, P < 0.0001.

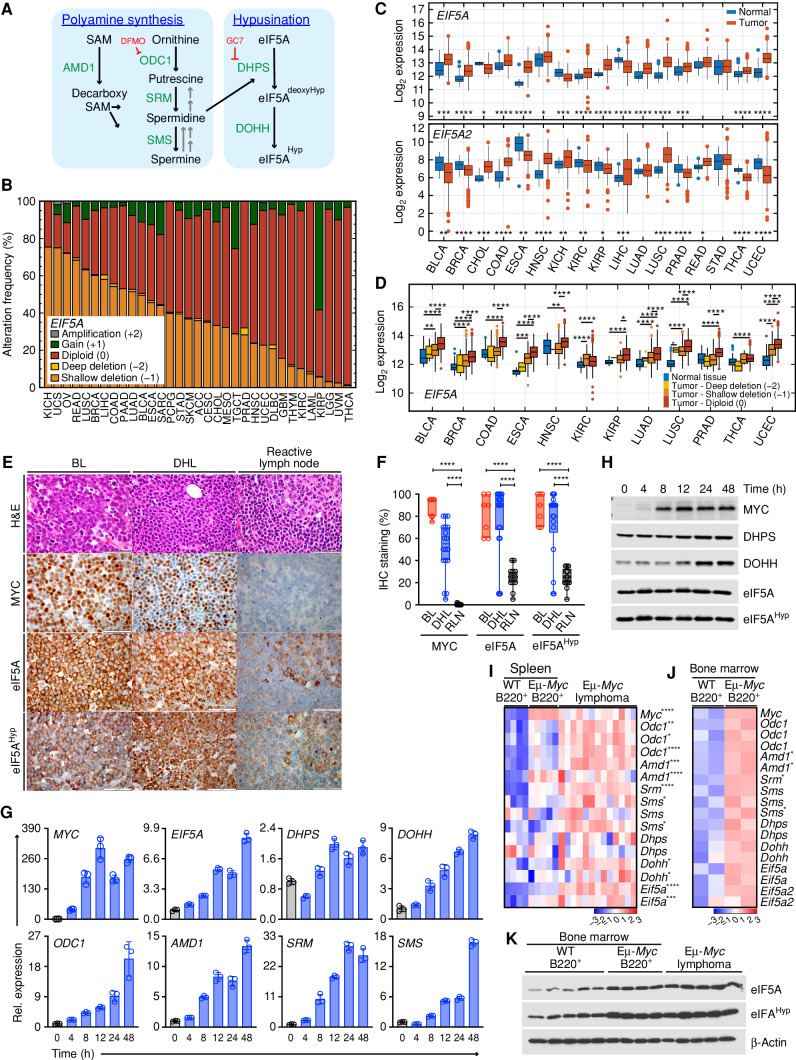
Activation of the polyamine–hypusine circuit is a hallmark of MYC-driven cancers. A, Schematic of the polyamine–hypusine pathway. AMD1, adenosylmethionine decarboxylase-1; dcSAM, decarboxy SAM; DHPS, deoxyhypusine hydroxylase; DOHH, deoxyhypusine hydroxylase; DFMO, difluoromethylornithine; eIF5A, eukaryotic translation initiation factor 5A; GC7, N1-guanyl-1, 7-diamine-heptane; Hyp, hypusine; ODC, ornithine decarboxylase; SAM, S-adenosylmethionine; SMS, spermine synthase; SRM, spermidine synthase. B, Copy-number alterations (CNA) of EIF5A across different cancer types. The abbreviations for the tumor types are provided in Supplementary Fig. S1A. C,EIF5A and EIF5A2 levels in RNA sequencing datasets in 17 cancer types derived from TCGA PanCanAtlas. D,EIF5A transcript levels relative to normal tissue, classified based on EIF5A copy number (TCGA data sets). E, Representative hematoxylin and eosin (H&E) staining and IHC of MYC, eIF5A, and hypusinated eIF5A (eIF5AHyp) proteins in patients with either BL (n = 7) or DHL (n = 18), or reactive lymph node samples (n = 13; Moffitt Cancer Center; scale bar, 50 μm). F, Box plots showing IHC staining (%) of the indicated proteins for each patient (open circle). G, Expression of genes in the polyamine–hypusine circuit following induction of MYC in p493-6 human B-lymphoma cells, as analyzed by qRT-PCR (n = 3, fold change to expression at time 0). H, Immunoblot analyses of MYC, DHPS, DOHH, eIF5A, and eIF5AHyp levels in p493-6 human B-lymphoma cells following MYC induction. I and J, Gene-expression profiling of arrays showing the polyamine-hypusine genes in mouse splenic B220+ B cells from premalignant Eμ-Myc (n = 5) and wild-type (WT; n = 4) mice and Eμ-Myc lymphomas (n = 13) from GSE32239 (I), and bone marrow (BM) of premalignant Eμ-Myc (n = 2) and WT (n = 2) littermate mice from GSE33474 (J). Rows represent different probe sets. K, Representative immunoblots of eIF5A and eIF5AHyp in mouse B220+ B cells isolated from BM of 6-week-old WT mice (n = 5) and premalignant Eμ-Myc mice (n = 4), and in lymphomas isolated from Eμ-Myc mice (n = 5). Levels of significance determined by Mann–Whitney test (B), Dunnett multiple comparison (F) or unpaired t tests (J) are indicated as follows: *, P < 0.05; **, P < 0.01; ***, P < 0.001; ****, P < 0.0001.