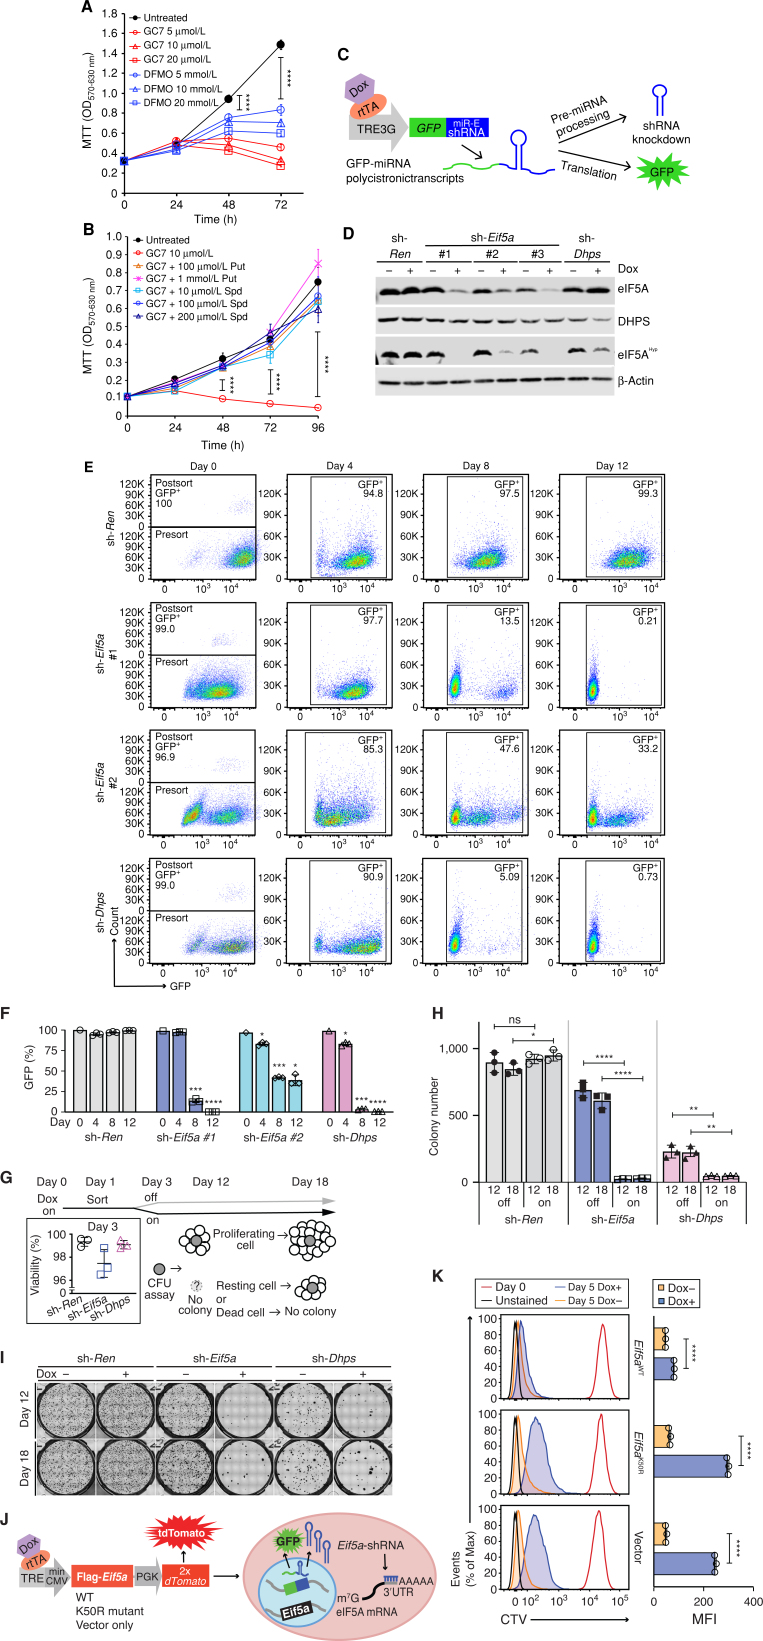
Figure 2.
Depletion of eIF5A or DHPS suppresses the growth of human and mouse MYC-driven lymphoma. A and B, MTT assays showing growth inhibition of human Raji BL cells following treatment with GC7 or DFMO (A) and rescue of GC7-induced growth inhibition by addition of putrescine (Put) or spermidine (Spd; n = 4; B). C, Schematic illustrating the miRE shRNA system, which generates GFP-shRNA polycistronic transcripts. D, Immunoblots showing levels of indicated proteins in Eμ-Myc;Rosa26-rtTA cells inducibly expressing sh-Eif5a #1, sh-Eif5a #2, sh-Eif5a #3, sh-Dhps, or sh-Ren. E, Representative FACS profile showing retention of cells expressing indicated GFP-shRNAs following cell sort. F, Quantification of GFP+ cell populations at the indicated intervals based on results in E (n = 3). G–I, Methycellulose colony formation unit (CFU) assays evaluating long-term effects of depletion of eIF5A or DHPS on clonogenic potential. G, Schematic illustrating the experimental design; inset shows the viability of cells at day 3 as evaluated by trypan blue dye exclusion. H and I, Representative photos taken at days 12 and 18 showing colony size and number (H) and quantification of colony numbers (I; n = 3). J, Schematic of experimental design where sh-Eif5a-expressing cells also inducibly express either eIF5AWT or eIF5AK50R or the vector alone. K, Rescue of cell proliferation by induction of eIF5AWT in eIF5A-depleted cells, as determined by flow cytometry of CellTrace Violet (CTV) stained cells, and quantification of mean fluorescence intensity (MFI). Left, representative histograms; right, the quantified data of day 5 Dox+ (GFP+TdTomato+, blue) vs. Dox− cells (orange; n = 3). Levels of significance determined by unpaired t tests are indicated as follows: ns, not significant; *, P < 0.05; **, P < 0.01; ***, P< 0.001; ****, P < 0.0001. Error bar indicates mean ± SD. Max, maximum.

