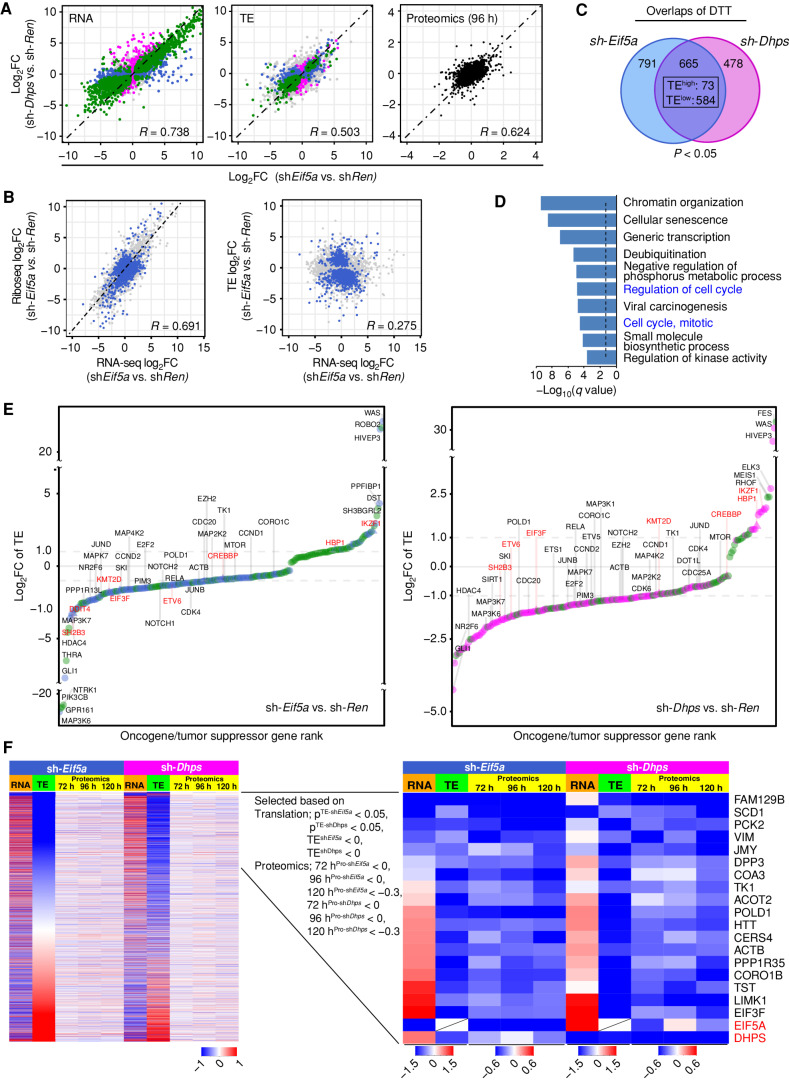
Figure 5.
The eIF5AHyp-dependent translational landscape of Eμ-Myc lymphoma. A, Correlation plots showing concordant effects of Eif5A and Dhps knockdown on gene expression (left, R = 0.738), translation efficiency (middle, TE, R = 0.503), and steady-state protein levels (right, R = 0.624) in sh-Eif5a- and sh-Dhps- vs. sh-Ren-expressing Eμ-Myc lymphoma cells. Correlations are displayed as scatterplots where green, blue, and pink colors indicate significance for both sh-Eif5a- and sh-Dhps (green), for only sh-Eif5a (blue), or for only sh-Dhps (pink); gray, not significant. Black denotes proteomic samples at the 96 hours time point. q < 0.05 was used to determine the significance for RNA-seq and P < 0.05 was used for TE data sets. B, Scatter plots showing correlation among log2 fold changes in RNA-seq, Ribo-seq, and TE analyses following eIF5A depletion. Blue indicates differentially translated transcripts (DTT, P < 0.05); gray indicates nonsignificant transcripts. C, Venn diagram of DTTs in sh-Eif5a- (blue) or sh-Dhps- (pink) knockdown Eμ-Myc lymphoma cells (P < 0.05; 657 concordantly shared transcripts, TElow: 584 and TEhigh: 73). D, Metascape enrichment analysis of the 584 TElow genes showing the top 10 categories. The dotted line shows q = 0.05. E, A ranked list of log2-fold change of TE for 244 and 204 differentially translated oncogenes (circles) and tumor suppressors (triangles) in eIF5A- (left) or DHPS- (right) depleted cells. Dot colors indicate significance for both sh-Eif5a and sh-Dhps (green), for only sh-Eif5a (blue), or for only sh-Dhps (pink). Names of select oncogenes are in black; tumor suppressors are in red. F, Identification of shared TElow transcripts having reduced levels of their corresponding proteins following Eif5a or Dhps knockdown in Eμ-Myc lymphoma. Left, heat maps of all transcripts sorted based on low to high TE-log2 fold changes (green columns 2 and 7). Orange column (columns 1 and 6) indicates RNA-seq log2 fold changes of these transcripts (72 hours). Yellow columns indicate the time course of TMT proteomic analyses (72, 96, and 120 hours). Right, among the shared significant TElow transcripts (P < 0.05), a time-course analysis of concordantly reduced encoded proteins in both sh-Eif5a and sh-Dhps cells.

