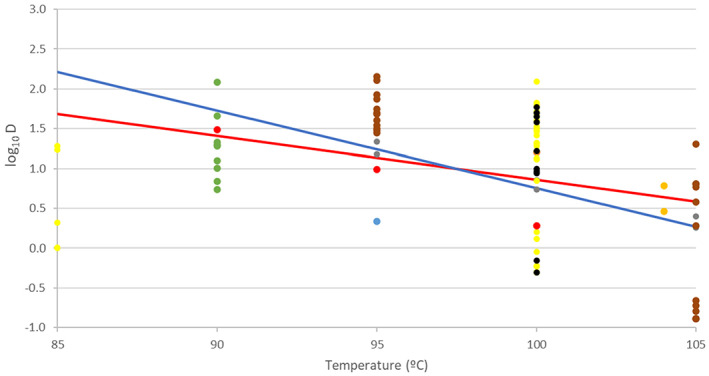
Figure 5.

Scatter plot of the log10 D [min] of Clostridium perfringens spores in different matrices versus temperature, showing Bigelow models for use in methods 2–4 and 7 (fitted to all data; red line) and method 5 (fitted to beef slurry, beef gravy and pork luncheon roll; blue line). Black: water or broth; orange: beef gravy; yellow: DS (Duncan and Strong medium); red: pork luncheon roll; grey: beef slurry; blue: fruit juice; brown: sodium phosphate buffer; dark orange: distilled water; green: not stated
