
Figure 9.
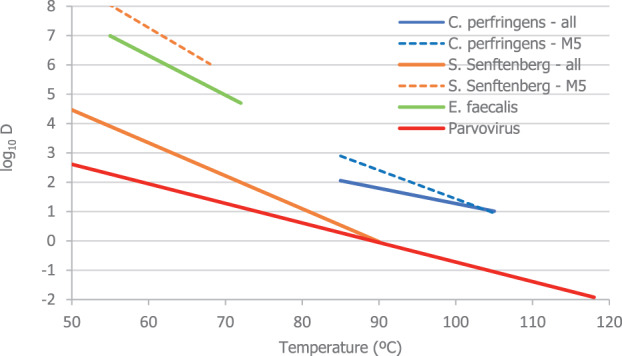
Predicted lines of the Bigelow models describing log10 D [min] as a function of temperature for the four target pathogens. Thick lines denote models fitted to all available matrices, and dashed lines to proteinaceous matrices. The temperature range of the lines covers the range for which data were available, to prevent extrapolation