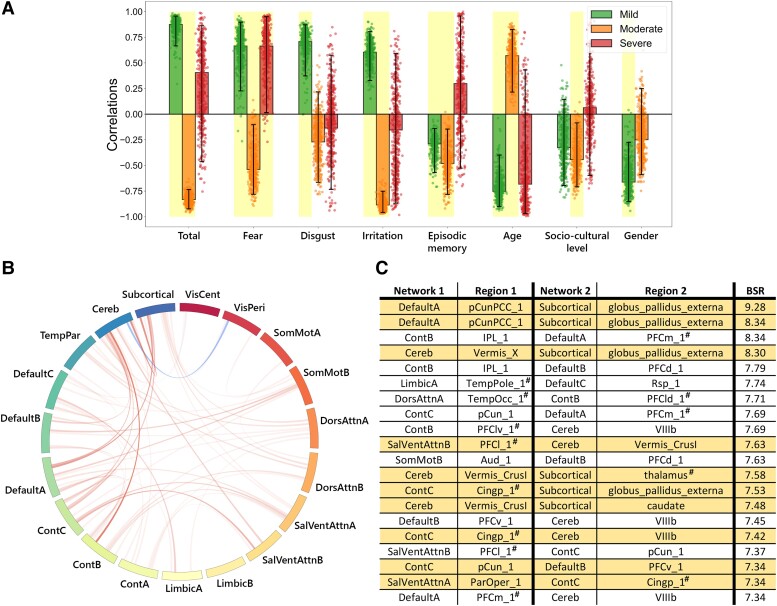
Figure 4.
Multivariate latent component from the group PLSC analysis. (A) Loadings of behavioural data. PLSC loadings were defined as correlation coefficients between a given feature and its weight in the latent component. Dots represent samples from the bootstrap procedure, and yellow highlights indicate the reliability of the scores’ contributions to the multivariate correlation components. (B) Bootstrap sampling ratios for functional connectivity (5% highest positive and negative values evaluated with bootstrap). This network representation illustrates the neuroimaging pattern, with red links indicating a positive influence of functional connectivity on the latent component and darker colours indicating a higher number of significant connections for each resting-state networks’ pair involved in the pattern. (C) Twenty brain networks and regions whose connections had the greatest impact [bootstrap sampling ratio (BSR)] on the latent component. Regions: Aud, auditory cortex; IPL, inferior parietal lobule; PCC, post cingulate cortex; pCun, precuneus; PFC, prefrontal cortex; RSP, retrosplenial cortex; TempOcc, temporal occipital area.

