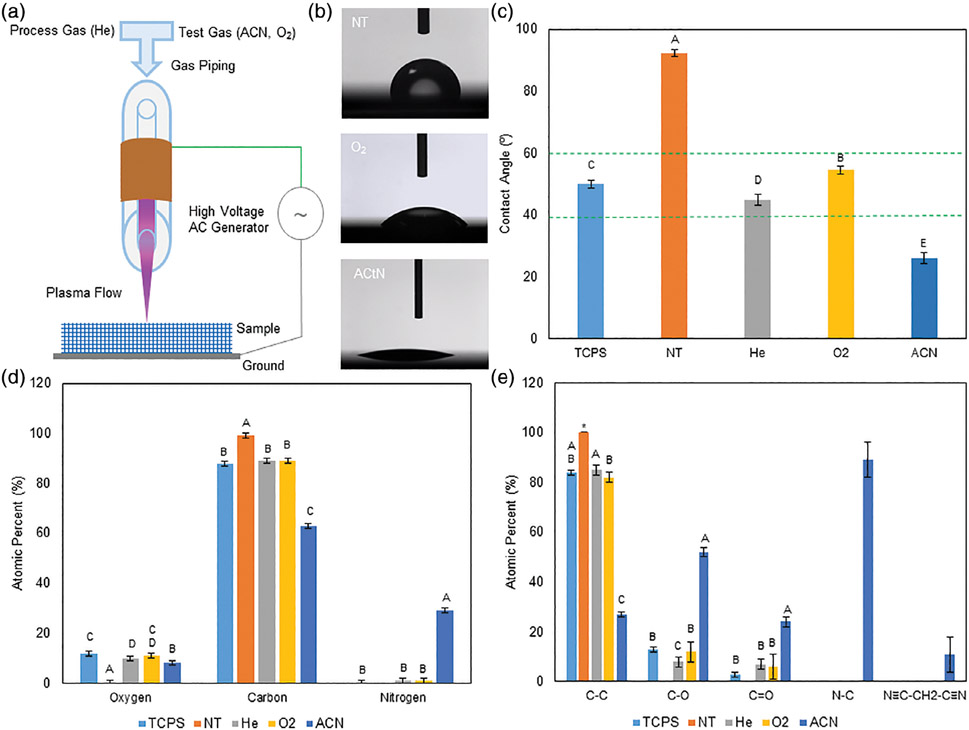
FIGURE 1.
A: Diagram of the DBD system with plasma flowing over the sample. B: Example contact angle images of the NT-, O2-, and ACN-treated surfaces. C: Quantified contact angles. Activating the surfaces with He, O2, and ACN reduced contact angles. Groups with different letters indicate statistical difference (p < 0.05), data are shown as mean ± standard deviation, n = 5. D: Survey XPS data shows surface oxygen and nitrogen presence on the DBD-treated surfaces and TCPS and nitrogen on the DBD-treated surfaces. Nitrogen presence in the DBD surfaces is likely a by-product of plasma treatment in ambient atmosphere. The greatest nitrogen presence was seen on the ACN-treated surfaces. Oxygen and nitrogen presence was accompanied by a reduction in carbon. E: High-resolution DBD-treated surfaces showed single bonded oxygen and carbonyl groups. TCPS showed both single bonded oxygen and carbonyl groups. NT surfaces remained purely carbon. Nitrogen presence on the ACN-treated surfaces were primarily bound to carbon as imine groups, with 13% of nitrogen on the surface was present as malononitrile. XPS data are shown as mean ± standard deviation; six scans per sample; single sample for NT, ACN, and TCPS; two samples for He and O2. Groups with different letters indicate statistical difference; asterisk indicates identical values (Tukey multiple comparison, p < 0.05).

