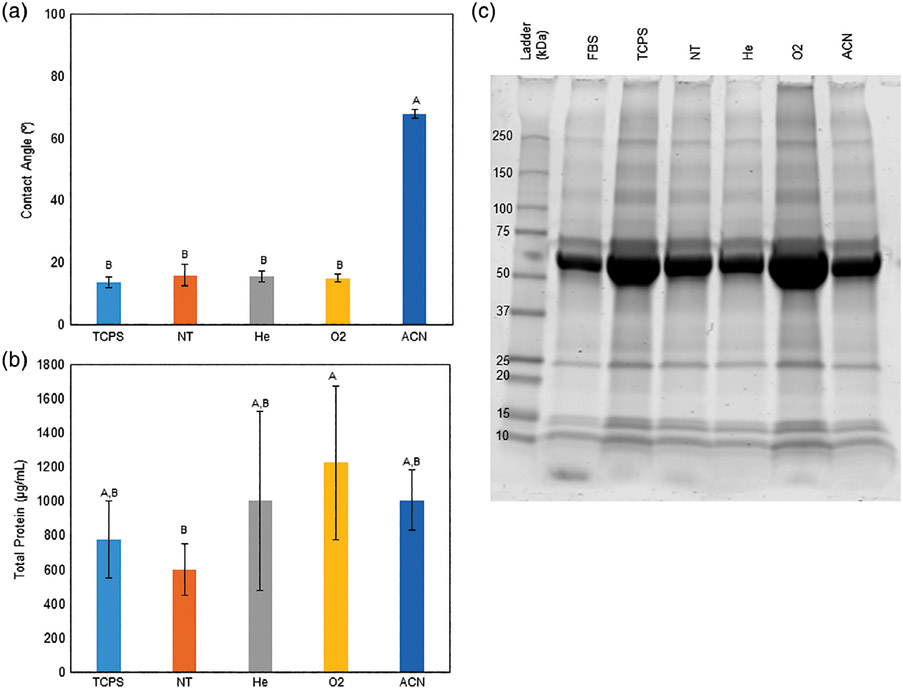
FIGURE 2.
A: Quantified contact angles across the surfaces following serum exposure. Contact angles were reduced for all surfaces except on ACN-treated surfaces. This indicates increased surface wettability and surface energy following exposure to serum. Groups with different letters indicate statistical difference (p < 0.05), data are shown as mean ± standard deviation, n = 5 except TCPS n = 4, ACN n = 3. B: Total protein content following coating. O2 surfaces showed statistically greater protein adhesion than the NT surface, but not different from any other surface. Data are shown as mean ± standard deviation, n = 3. C: Coomassie stained gel. Visually, the O2 surface band appears darker than the NT surface across the whole lane. Similar bands are observed across all treatment samples and the source serum.

