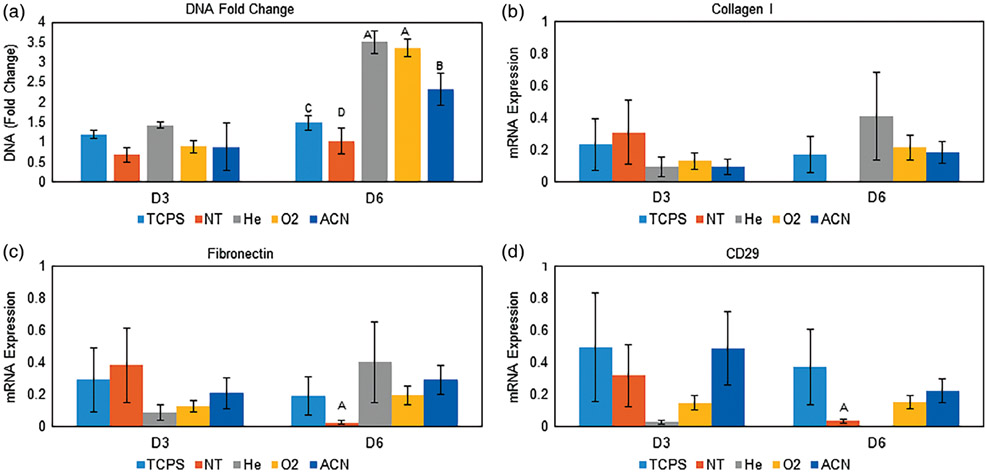
FIGURE 5.
A: Normalized DNA content to each D0 value. The He and O2 surfaces showed the greatest DNA content fold change, followed by ACN, TCPS, and NT surfaces. This indicates surface activation successfully facilitated hMSC proliferation. Data are shown as mean ± standard deviation, n = 3. B: mRNA expression of collagen I. All surfaces showed detectable expression except for the NT surface. C: mRNA expression of fibronectin. All surfaces showed greater expression than the NT surface on day 6. D: mRNA expression of CD29. All surfaces showed detectable expression except for the He surface. Statistically greater expression was seen on TCPS, O2, and ACN surfaces compared to the NT surface at day 6. For ΔΔCT mRNA expression, depressed expression on the NT surface at day 6 may indicate reduced ability to modify the surrounding environment and express ECM proteins, likely related to the underlying protein content directed by the surface chemistry. Note: groups with different letters indicate statistical difference (p < 0.05) for ANOVA was performed on each time point. For B-D, data are in technical triplicate and displayed as mean ± standard deviation.

