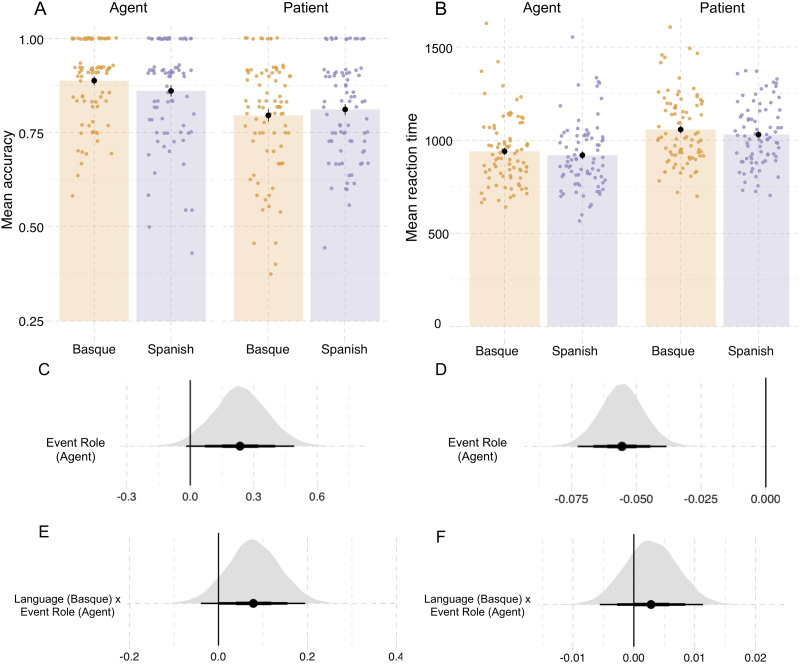
Figure 4. .
Results from probe recognition task in Experiment 1. (A) Recognition accuracy for probe pictures. (B) Reaction times (in milliseconds). Individual dots represent participant means, black dots represent the mean of participant means, and error bars indicate 1 standard error of the mean. Figure F2 in the Appendix shows fitted values from the Bayesian regression model. (C and D) Posterior estimates for the predictor event role from the Bayesian regression models for accuracy and reaction time, respectively (Tables D2 and D3). (E and F) Posterior estimates of the interaction between language and event role from the same models for accuracy and reaction time, respectively. Point intervals represent the 50%, 80%, and 95% credible intervals.

