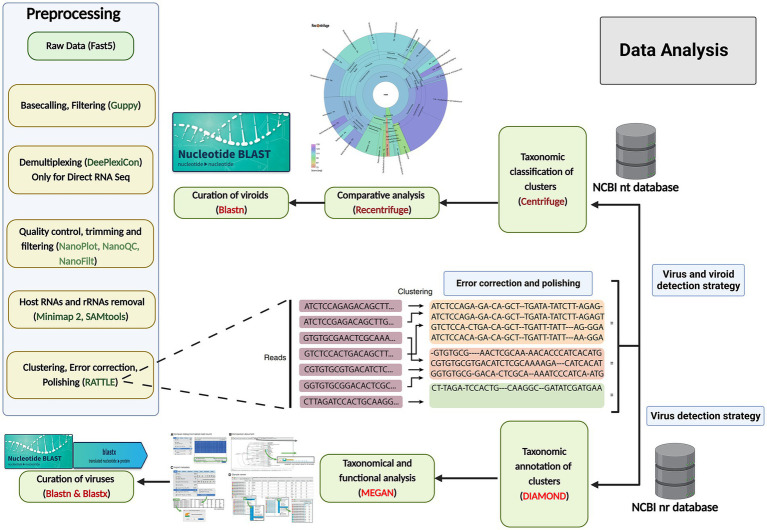
Figure 2.
Data analysis workflows for grapevine virus and viroid detection through nanopore sequencing. Preprocessing of raw data (left): The raw data were acquired through MinKNOW software, and then base-calling, filtering based on the quality score (<7), demultiplexing, trimming, the removal of host reads and clustering were performed, followed by error correction and polishing, using various software and software packages. Centrifuge and Recentrifuge strategy (Upper right): Preprocessed reads were taxonomically classified using Centrifuge, followed by a comprehensive analysis by Recentrifuge, which provided a visualization. DIAMOND+MEGAN strategy (Lower right): In addition, the same reads from the previous step were aligned against annotated protein sequences (NCBI-nr) using DIAMOND, and subsequently, MEGAN 6 was used to bin the sequences based on their taxonomy and function profiles. To further curate the taxonomic results, BLASTn and BLASTx were also run.

