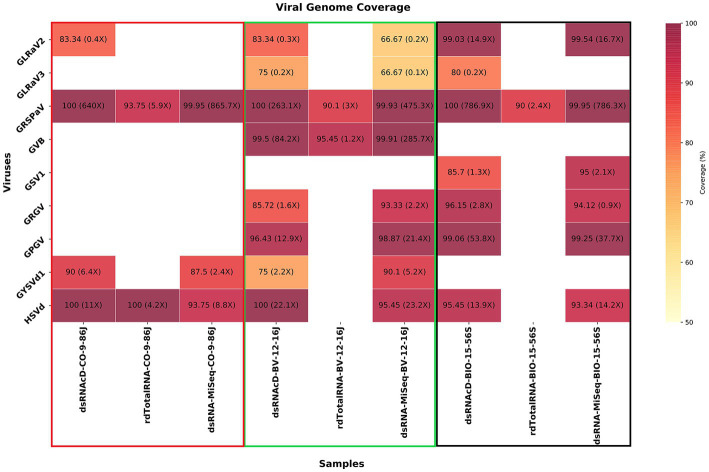
Figure 7.
A heatmap illustrating the percentage of viral genome coverage and depth for three different grapevine samples. In each cell, the associated number represents the percentage of genome coverage, followed by the depth of coverage in parentheses. Colors that are darker indicate higher genome coverage percentages.

