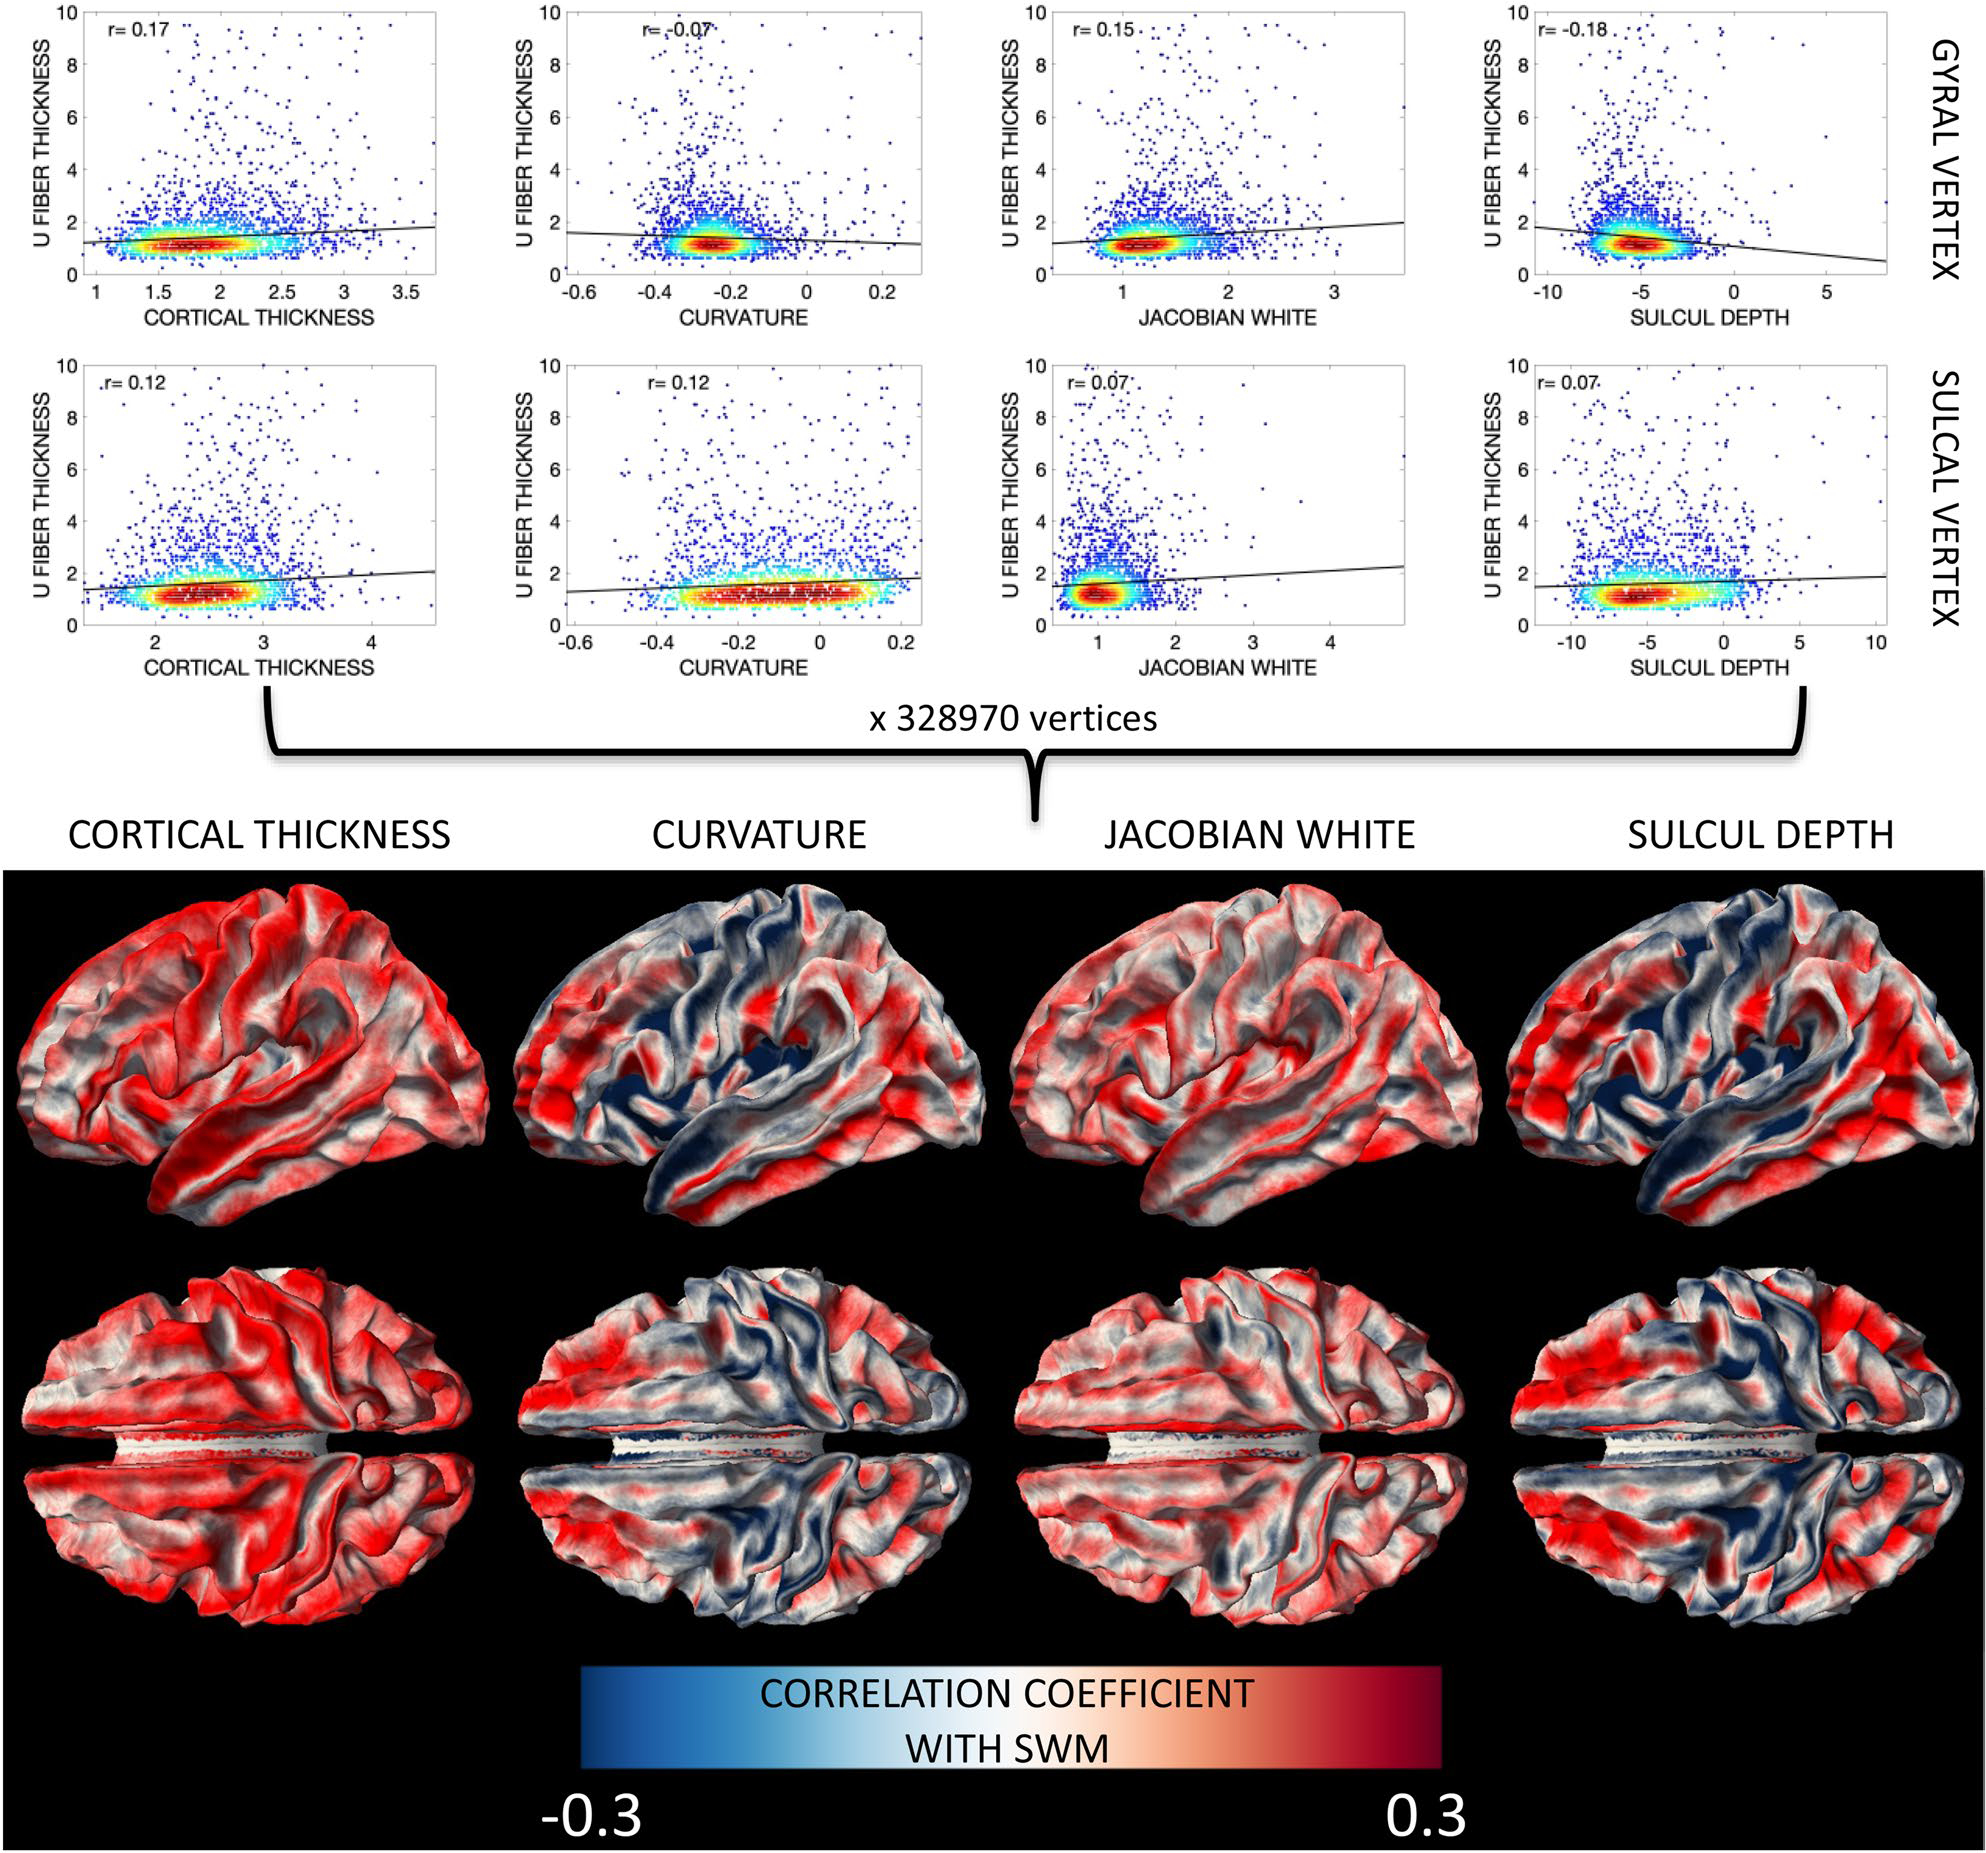
Fig. 7.

SWM thickness shows cross-sectional relationships with FreeSurfer-defined features of the cortex (cortical thickness, curvature, Jacobian of the white matter, and sulcal depth) that vary based on brain location. Here, for every vertex, a robust correlation coefficient between SWM thickness and cortical feature across the population was calculated (plots shown in bottom row) and displayed on the white/gray matter boundary for all vertices (top row). Results separated by age group are given in supplementary information
