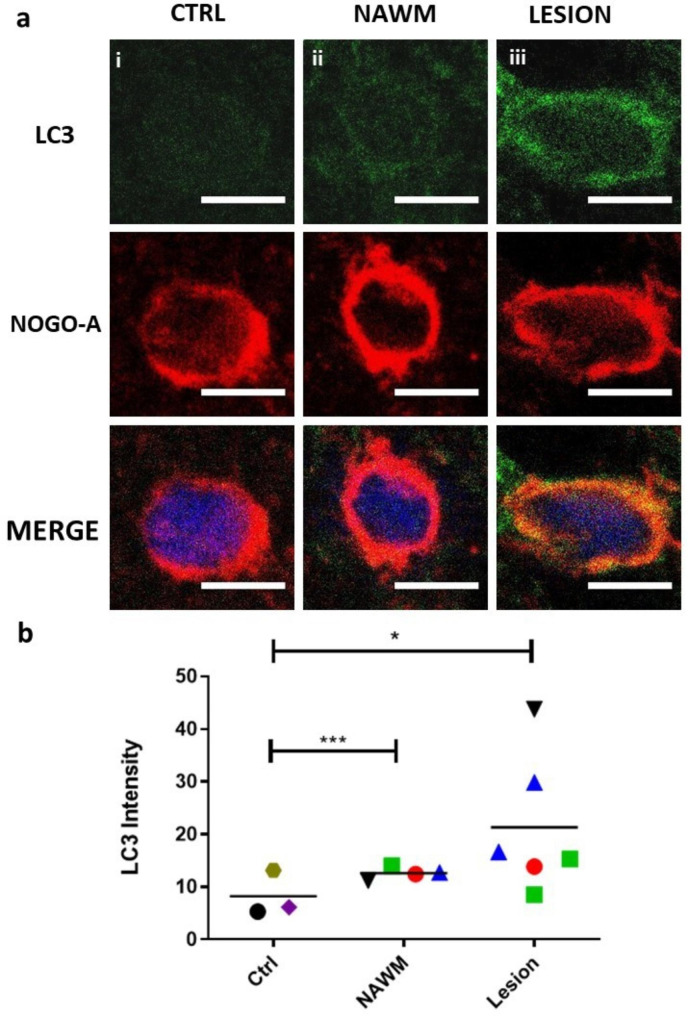
Fig. 2.
Increased expression of the autophagy marker LC3 in MS lesions and NAWM compared to controls. a Sample images showing relative expression of LC3 in a non-MS CTRL case, in NAWM from an MS case, and in a chronic active lesion of an MS case. Scale bars correspond to 5 μm. b Quantification of LC3 expression as measured by average immunofluorescence intensity of LC3 in OLs in healthy controls, NAWM, and chronic active MS lesions. Individual regions of interest are indicated by color and shape corresponding to 3 non-MS controls, 4 NAWM regions, and 6 lesions from 4 individuals with MS. Statistical significance was assessed using Student’s t-test: * (< 0.05), *** (< 0.001)

