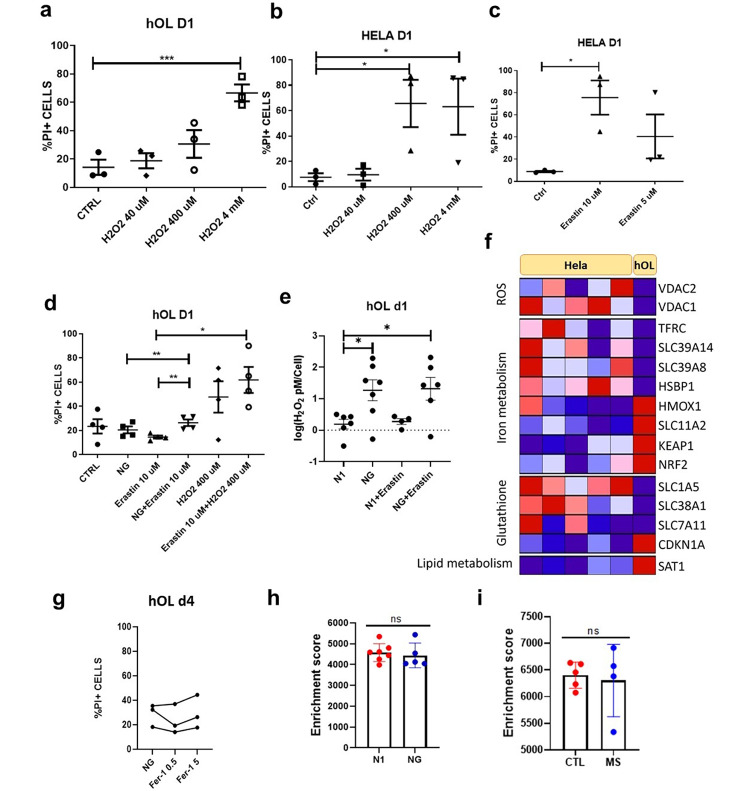
Fig. 5.
ROS mediates limited damage in hOL following metabolic stress. a-b hOLs and HeLa cells were treated with hydrogen peroxide for 1 day at different concentrations and rate of cell death was measured by PI assay. a hOL cell death was increased only by 4 mM H2O2. b HeLa cell death was substantially increased by 400 μm of H2O2. Statistical significance was assessed using an ANOVA/Tukey test: *(< 0.05), ***(< 0.001). c HeLa cells were treated with Erastin at different concentrations for 1 day. Cell death was significantly increased by treatment with 10 µM of erastin. Statistical significance was assessed using a Student’s t-test: *(< 0.05). d hOLs were treated with Erastin, NG, H2O2 or combination of these treatments for 1 day. Cell death was only significantly increased with the combined treatment of Erastin with NG and not with NG or Erastin alone. Statistical significance was assessed using a Student’s t-test: *(< 0.05), **(< 0.01). e H2O2 levels measured in hOLs treated with Erastin in optimal and NG conditions. H2O2 levels were increased under NG conditions alone. No additional effect of Erastin was detected. Statistical significance was assessed using an ANOVA/Dunnett’s test: *(< 0.05). f Genes presenting significant difference in their transcriptional expression in hOLs compared to HeLa cells were categorised according to the pathway involved in ferroptosis. Genes upregulated are shown in red and downregulated in blue. HeLa cell data were obtained from publicly available databases [1, 10, 17]. hOLs data was obtained from a bulk RNA sequencing database that we have previously published [31]. g Rate of hOL cell death under NG conditions following treatment with Ferrostatin-1 for 4 days, measured by PI assay. No significant differences were observed between treatment conditions. Each dot/line in the graphs corresponds to an independent biological sample. Statistical significance was assessed using an ANOVA/Dunnett’s test. h Comparison of the enrichment score of genes related to ferroptosis in N1 and NG conditions in vitro. Mean ± SEM for each condition shown in the figure. Statistical significance was assessed using a Student’s t-test: *(< 0.05). i Enrichment score of genes related to ferroptosis in MS cases compared to “control” individuals. Mean ± SEM for each condition shown in the figure. Statistical significance was assessed using a Student’s t-test: *(< 0.05)

