Fig. 7.
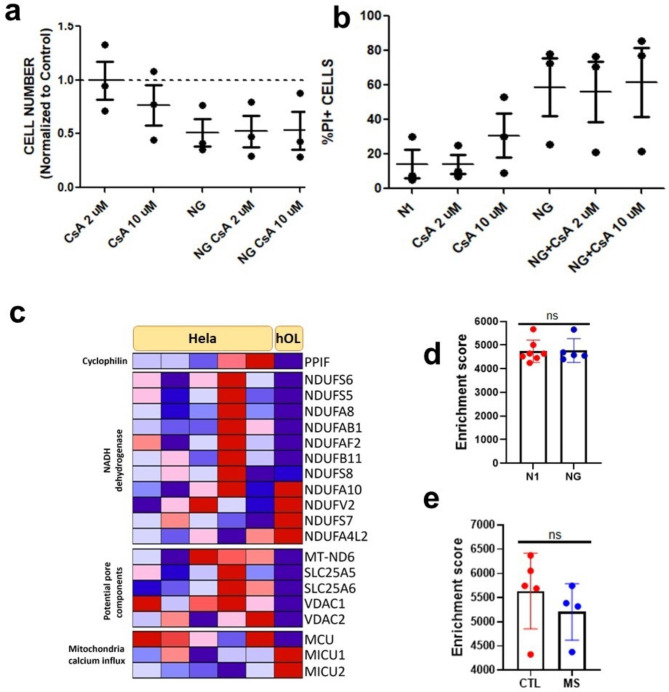
Metabolic stress triggers spectrin cleavage without activation of MPT-driven necrosis. a-b hOLs treated with CsA at 2 µM and 10 µM in combination with N1 and NG conditions did not cause a reduction in cell number or increase in PI-positive cells after 4 days of treatment. Each dot in the graphs corresponds to an independent biological sample. Mean ± SEM for each condition is shown in the figure. Statistical significance was assessed using a ANOVA/Dunnett’s test. c Genes presenting significant differences in their transcriptional expression in hOLs compared to HeLa cells were categorised according to pathways involved in MPT-driven necrosis. Genes upregulated are shown in red and downregulated in blue. HeLa cell data was obtained from publicly available databases [1, 10, 17]. hOLs data was obtained from a bulk RNA sequencing database that we have previously published [31]. d Comparison of the enrichment score of genes related to MPT-driven necrosis in N1 and NG conditions in vitro. Mean ± SEM for each condition shown in the figure. Statistical significance was assessed using a Student’s t-test: *(< 0.05). e Enrichment score of genes related to MPT-driven necrosis in MS cases compared to “control” individuals. Mean ± SEM for each condition shown in the figure. Statistical significance was assessed using a Student’s t-test: *(< 0.05)

