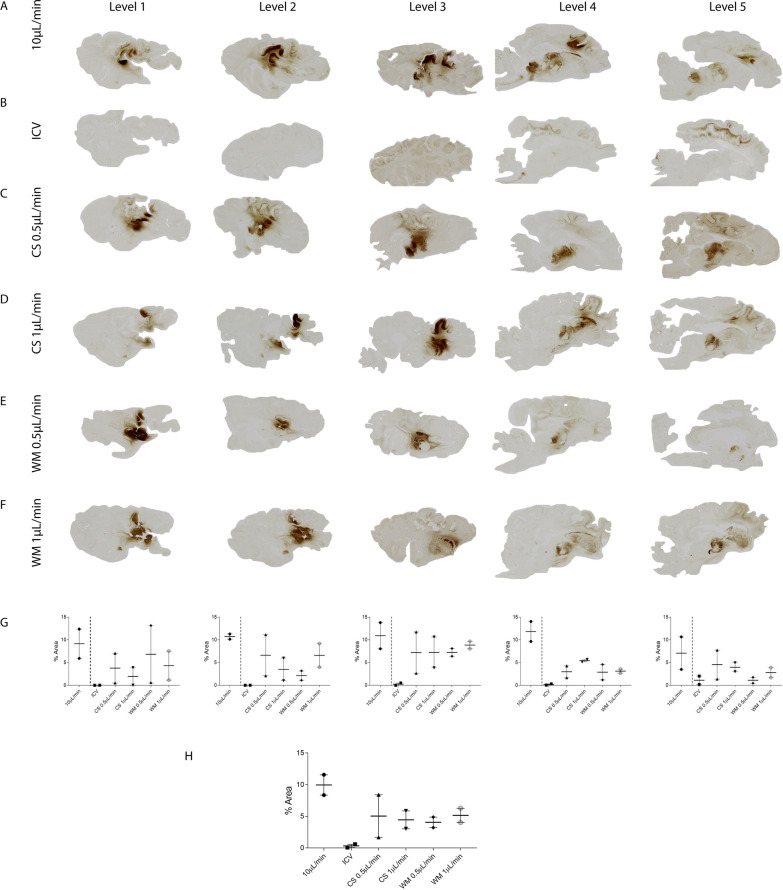
Fig. 2.
Comparative distribution of GFP expression in sheep brains in study 1. Images showing GFP expression in sheep brains 3 weeks post-injection. Sheep received AAV9-GFP (n=2/group) either into A four locations: the corpus striatum (CS), white matter (WM), subcortical zone (SC) and brainstem (BS), B the lateral ventricles (ICV), (C, D) CS and (E, F) WM with the latter two groups separated into two infusion flow rates (0.5 µL/min and 1 μL/min). G Average GFP expression across each sagittal brain level. H Average GFP expression across the entire hemisphere. Data are presented as mean ± s.e.m

