Fig. 5.

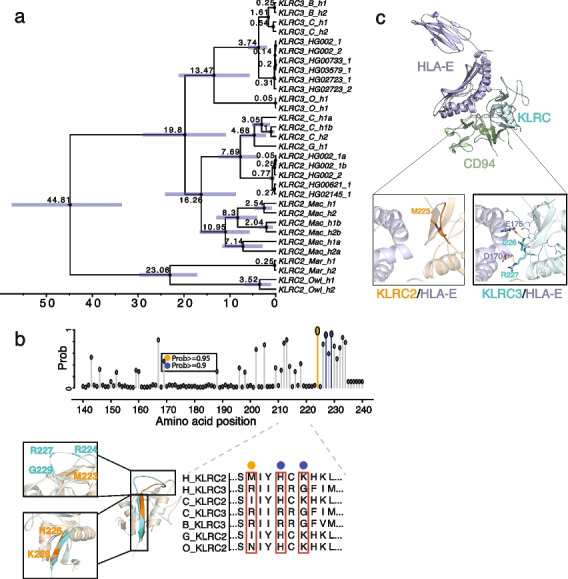
The potential functional differentiation between KLRC2 and KLRC3 by natural selection in primate evolution. a The phylogenetic tree reconstructed from KLRC2 and KLRC3 of humans and other NHPs with BEAST2 shows the duplication of KLRC2 and KLRC3 occurred at the common ancestor of African great apes. The 95% confidence interval of the estimated age of each node is shown in the blue bar. All nodes are supported by one posterior possibility shown in dark circle dots. The texts: C, B, G, O, Mac, Mar, and Owl in the tips represent chimpanzee, bonobo, gorilla, orangutan, macaque, marmoset, and owl monkey, respectively. b The possibility of amino acid under positive selection inferred by the branch-site model in PAML is shown on the top panel. The gray, orange, and blue dots represent the possibility of less than 0.9, between 0.9 and 0.95, or greater than 0.95, respectively. The amino acid alignment of KLRC2 and KLRC3 among primates is shown on the bottom right panel. Structure alignment of predicted structures of KLRC2 from residue 118 to 231 (orange, Uniprot: P26717) and KLRC3 from residue 118 to 240 (cyan, Uniprot: Q07444). The zoomed-in pictures depict the structural discrepancies in the loop (top) and the following β-sheet (bottom) between KLRC2 and KLRC3. c Predicted structures of KLRC/HLA-E/CD94 complex (KLRC2 from residue 118 to 231: orange, Uniprot: P26717; KLRC3 from residue 118 to 240: cyan, Uniprot: Q07444; Full-length HLA-E: purple, Uniprot: I3RW89; CD94 from residue 57 to 179: green, Uniprot: Q13241). The zoomed-in protein structure depicts the interaction interfaces of KLRC2/HLA-E (top) and KLRC3/HLA-E (bottom)
