
Figure 5.
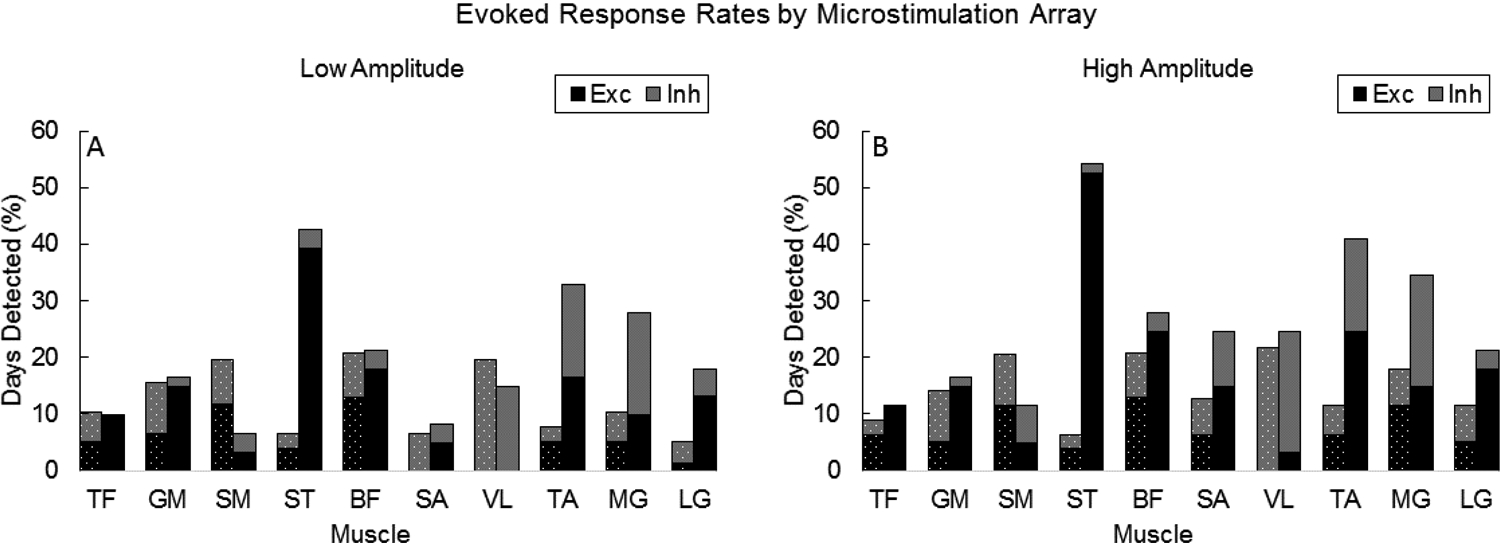
Stacked bar graphs illustrating cumulative response rates of detected motor responses from A) low- and B) high-amplitude microstimulation. Bars to the left (dashed) and right (solid) of each tick correspond to rates from microstimulation on L6 and L7 arrays. Black (excitatory) and grey (inhibitory) bars provide a breakdown of the composition of responses.