
Figure 6.
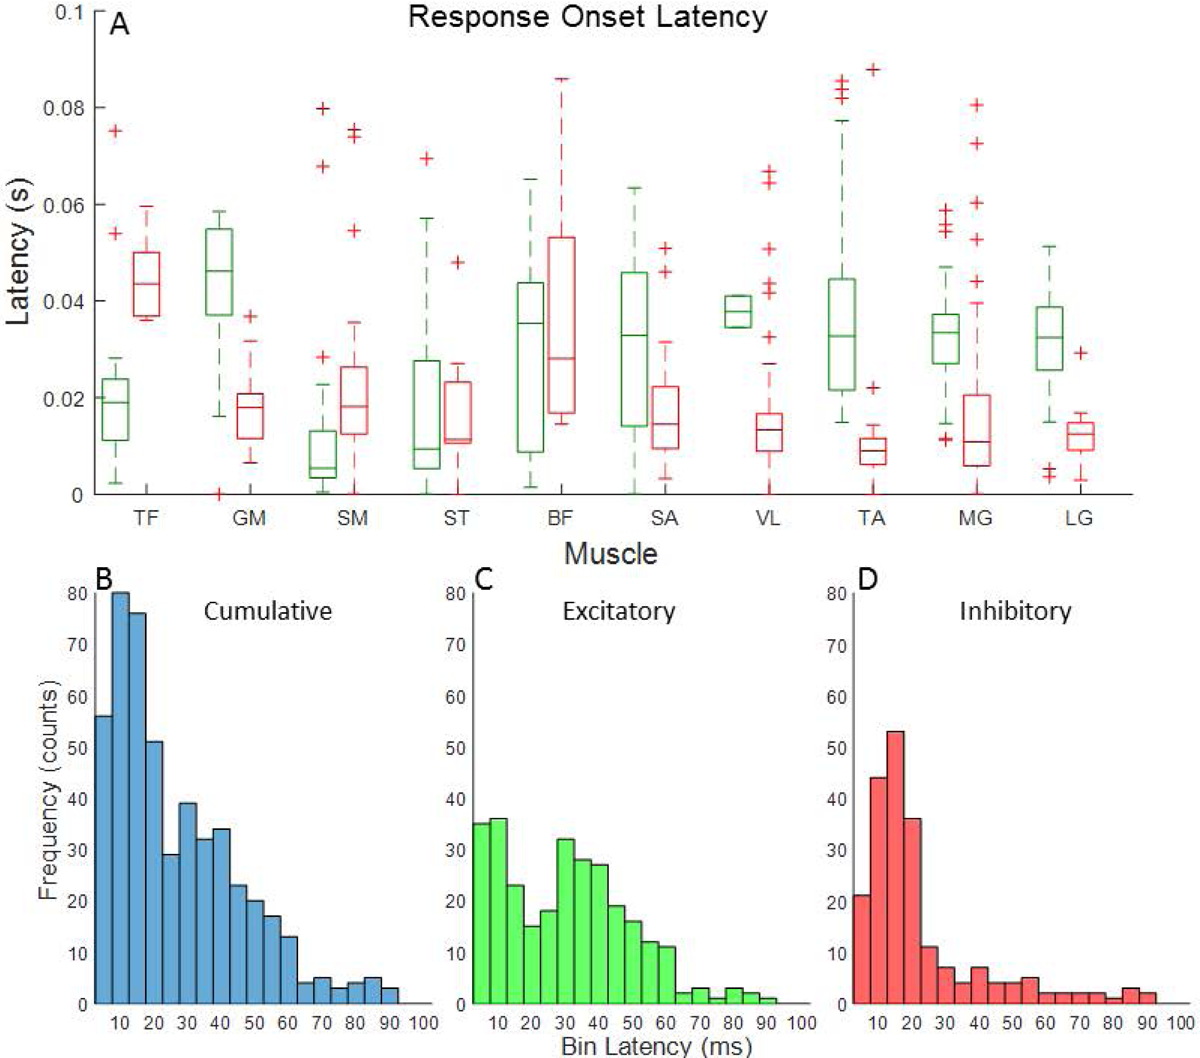
(A) Box plots showing the distribution of response onset latencies for excitatory (green) and inhibitory (red) evoked responses in each muscle. Histograms showing the frequency of response onsets (5 ms bins) for (B) all evoked responses combined, (C) excitatory responses only, and (D) inhibitory responses only.