
Figure 9.
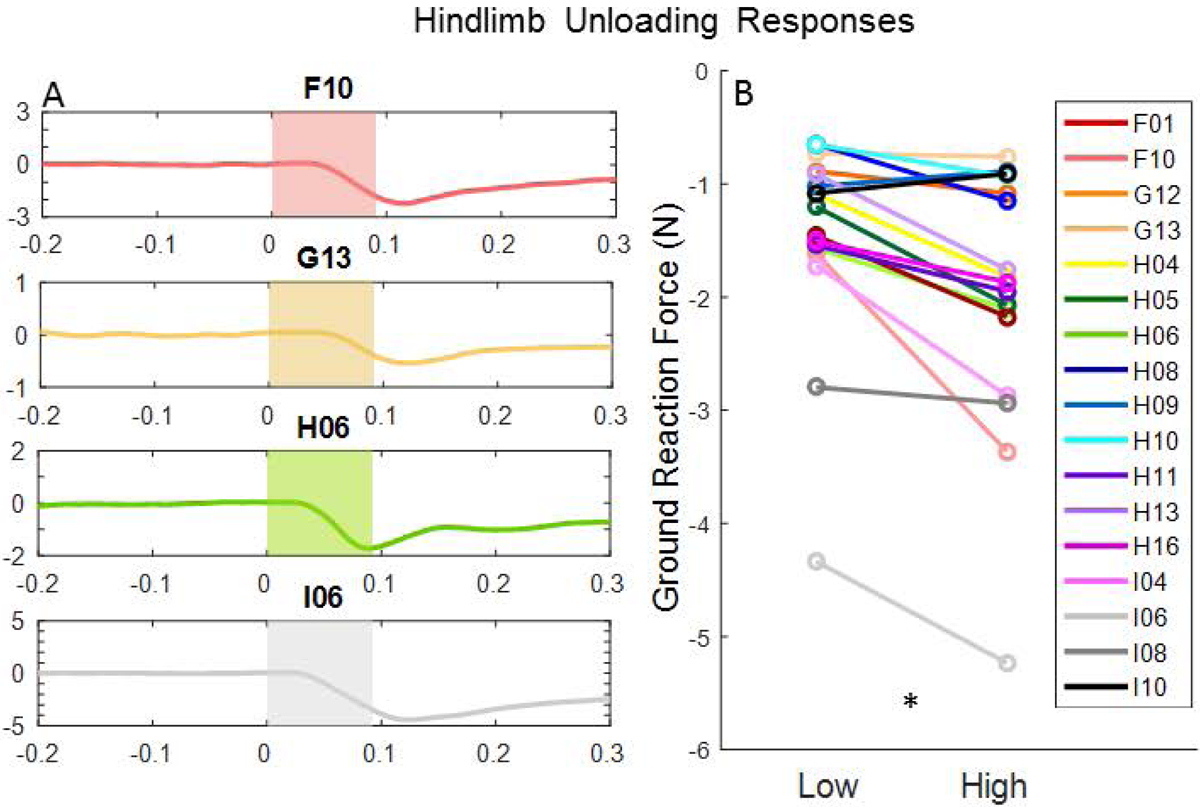
(A) Representative GRF profiles on testing weeks with microstimulation-induced unloading of the hindlimb in each cat tested. Shaded regions correspond to window in which the microstimulation train was delivered. (B) Line graph showing the change in GRF magnitude by microstimulation amplitude (*p<0.001).