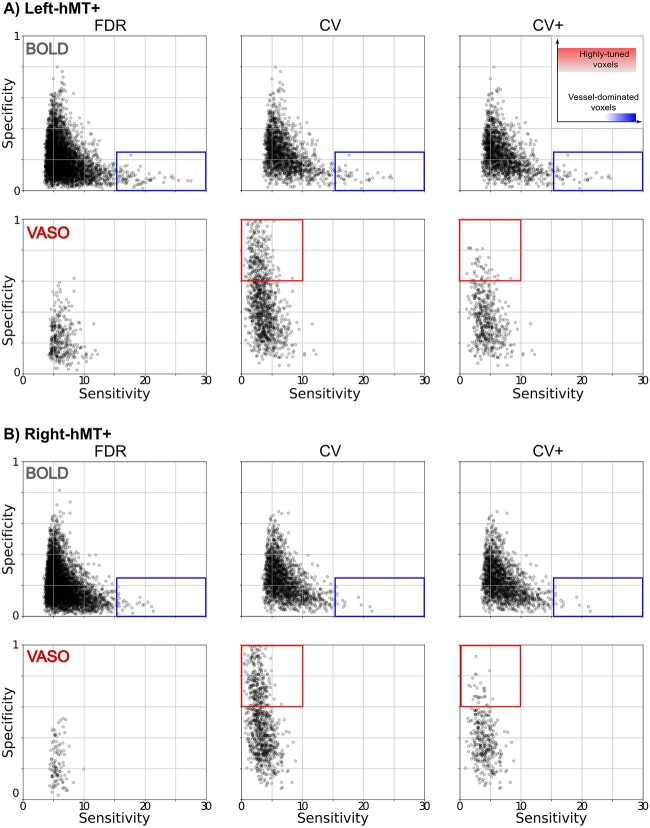
Fig. 5.
Group result for sensitivity and specificity scatterplot for both BOLD and VASO contrast in (A) left hMT+ and (B) right hMT+ for FDR (right column), CV (middle column) and CV+ (right column) voxel sets. The inset at the upper right corner shows in a qualitative way how different regions of the space are associated with different voxel characteristics. Rectangles highlight main differences between contrast types and voxel selection strategy. The red rectangle encompasses highly tuned voxels, whereas the blue area shows vessel-dominated voxels.

