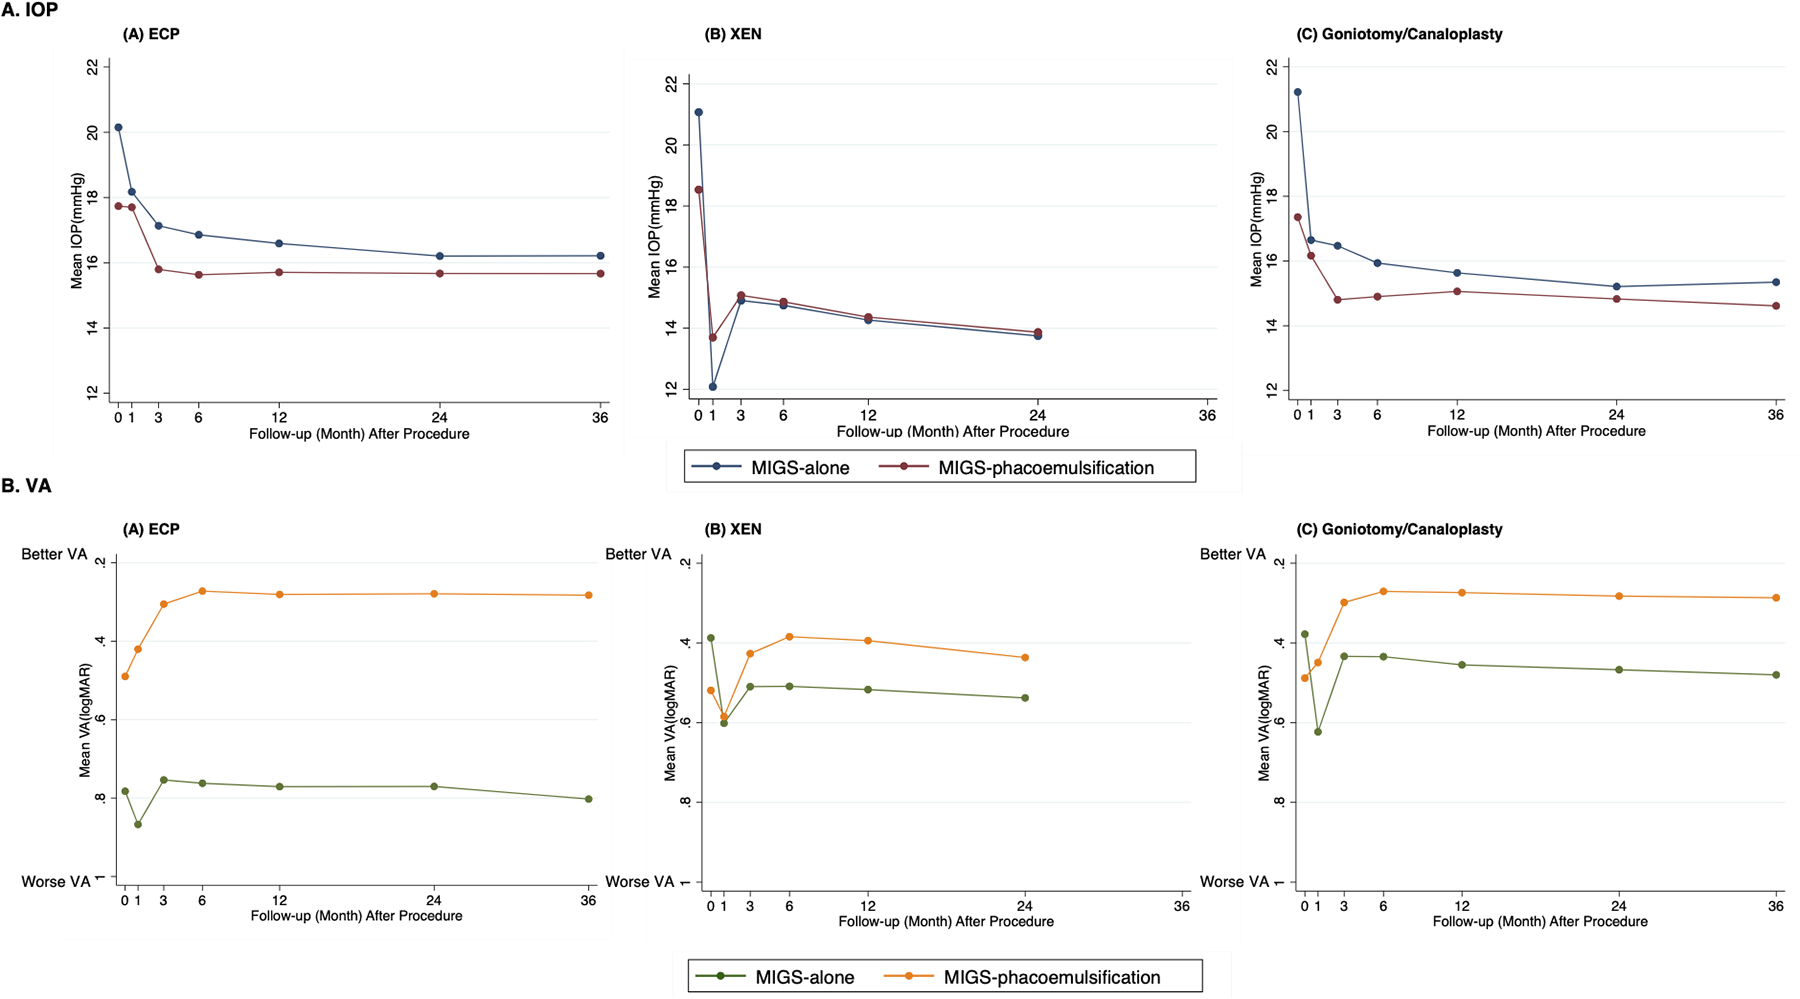
Figure 2. Mean Intra-Ocular Pressure and Visual Acuity over course of follow-up.

A. mean IOP over time: X axis: Follow-up (month) after procedure. Y axis: Mean IOP (mmHg). Color (Blue: MIGS procedure alone.; Red: MIGS procedure with phacoemulsification.). B. mean VA over time: X axis: Follow-up (month) after procedure. Y axis: Mean VA (logMAR). Color (Green: MIGS procedure alone; Yellow: MIGS procedure with phacoemulsification). Abbreviation: MIGS, micro-invasive glaucoma surgery.
