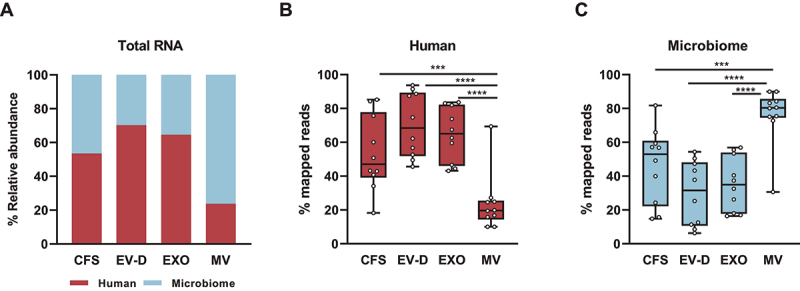
Figure 2.

Total RNA composition of CFS, EXO, MV, and EV-D. (A) Relative composition of total RNA across individual saliva fractions. (B) Box plot for the percentage distribution of human RNA across saliva fractions at individual donor level. (C) Box plot for the percentage of microbiomes across saliva fractions at individual donor level. CFS, cell-free saliva; EXO, exosome; MV, microvesicle; EV-D, EV-depleted saliva.
***P < 0.001, ****P < 0.0001.
