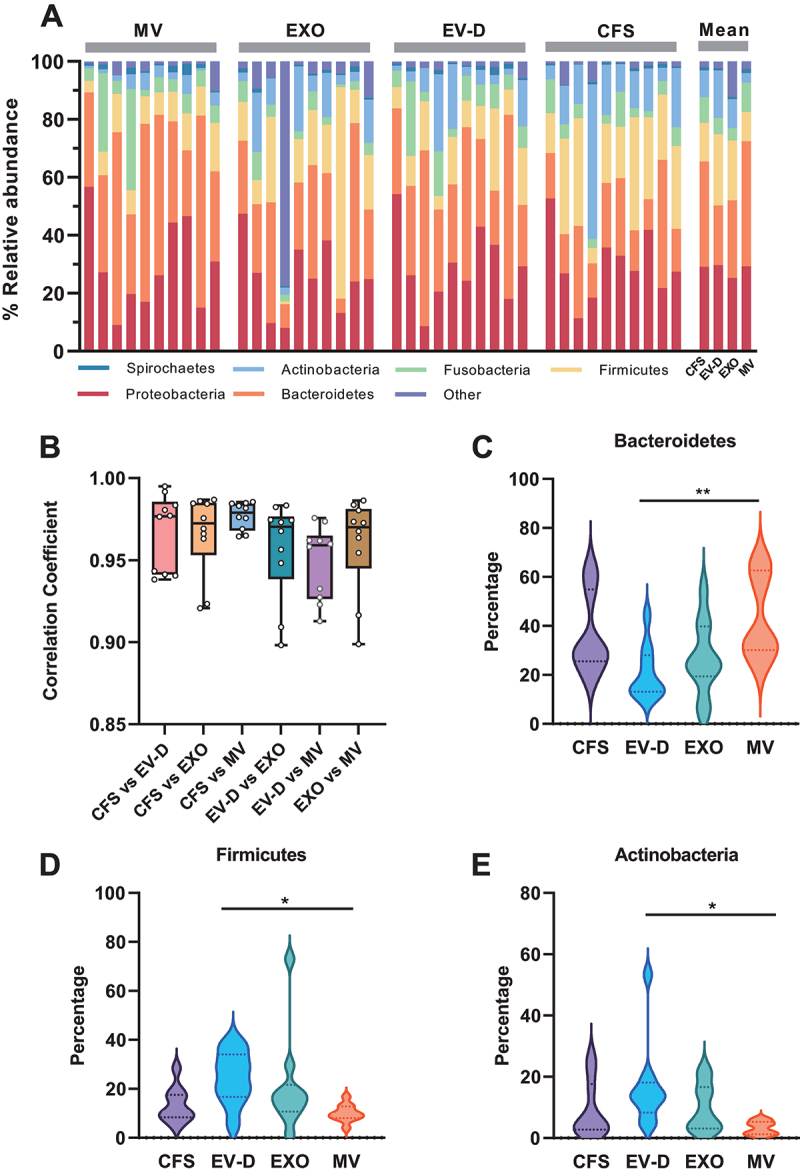
Figure 3.

The microbiome profiles of CFS, EXO, MV, and EV-D. (A) The microbiome composition of individual saliva fractions at the phylum level. (B) Distributions of pairwise correlation coefficients across four saliva fractions. (C-E) Violin plot depicting relative expression levels of Bacteroidetes (C), Firmicutes (D), and Actinobacteria (E) in individual saliva fractions. CFS, cell-free saliva; EXO, exosome; MV, microvesicle; EV-D, EV-depleted saliva.
*P < 0.05, **P < 0.01.
