Figure 6.

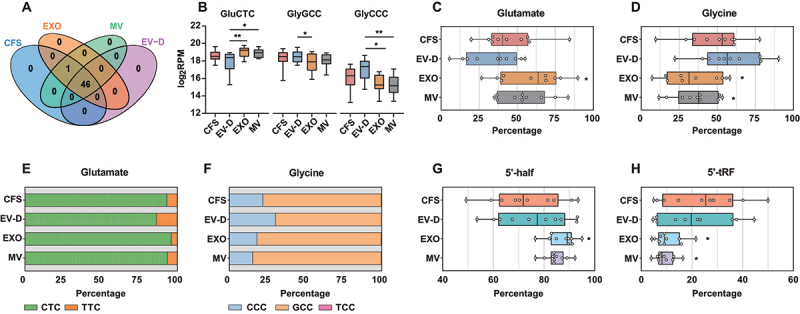
tRF expression profiles of CFS, EXO, MV, and EV-D. (A) Venn diagram to summarize unique and common tRFs across saliva fractions. (B) Relative expression levels of three most abundant tRFs in individual saliva fractions. (C-D) Box plot depicting the percentage distribution of tRFs across saliva fractions at individual donor level for glutamate (C), and glycine (D). (E-F) Composition of tRFs in individual saliva fractions for glutamate (E), and glycine (F). (G-H). Box plot depicting the percentage distribution of tRFs across saliva fractions at individual donor level for 5’-half tRFs (G) and 5’-tRFs (H). CFS, cell-free saliva; EXO, exosome; MV, microvesicle; EV-D, EV-depleted saliva; tRF, tRNA fragment.
*P < 0.05, **P < 0.01.
