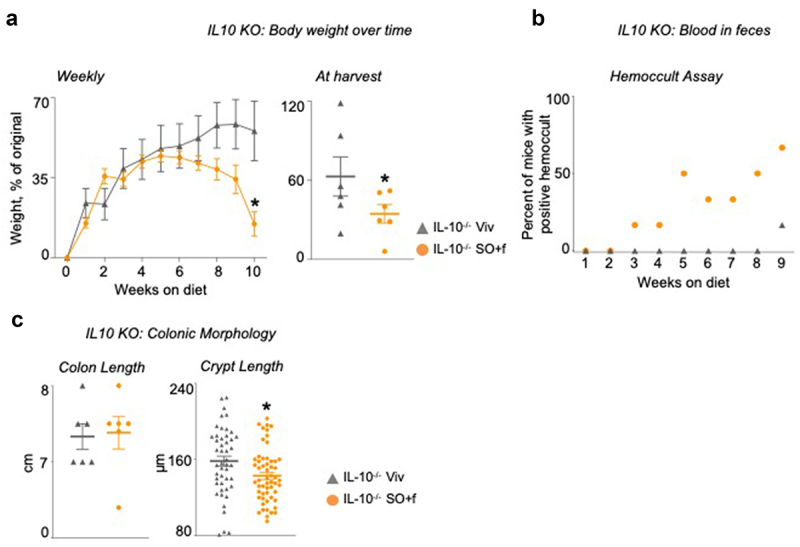
Figure 2.

A diet high in LA increases susceptibility to colitis in IL10−/− mice. IL10−/− mice fed SO+f or Viv diet for 10 weeks.
Notes: (s) Average weekly body weights and at harvest; the body weight at harvest is a few days after the last data point in the weekly body weight graph. (b) hemoccult assay. (c) colon length and crypt length. Scale bar is 400 microns. Colon sections are shown in Supplementary Figure 1. * vs Viv. T-test, P < .05 N = 5–12 per group.
